Follow


高性能なグラフ生成ライブラリ
PHP5、PHP7、PHP8対応の高機能なグラフ生成ライブラリ
20種類以上の豊富なプロット形式をサポート
JpGraph サンプル
← 一覧に戻るalphabarex1.php
<?php // content="text/plain; charset=utf-8"
require_once ("jpgraph/jpgraph.php");
require_once ("jpgraph/jpgraph_bar.php");
// Some data
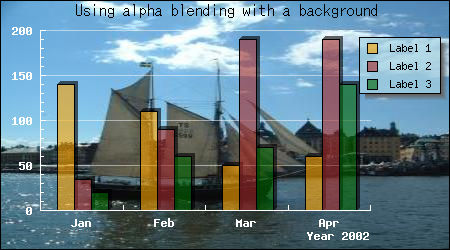
$datay1=array(140,110,50,60);
$datay2=array(35,90,190,190);
$datay3=array(20,60,70,140);
// Create the basic graph
$graph = new Graph(450,250,'auto');
$graph->SetScale("textlin");
$graph->img->SetMargin(40,80,30,40);
// Adjust the position of the legend box
$graph->legend->Pos(0.02,0.15);
// Adjust the color for theshadow of the legend
$graph->legend->SetShadow('darkgray@0.5');
$graph->legend->SetFillColor('lightblue@0.3');
// Get localised version of the month names
$graph->xaxis->SetTickLabels($gDateLocale->GetShortMonth());
// Set a nice summer (in Stockholm) image
$graph->SetBackgroundImage('stship.jpg',BGIMG_COPY);
// Set axis titles and fonts
$graph->xaxis->title->Set('Year 2002');
$graph->xaxis->title->SetFont(FF_FONT1,FS_BOLD);
$graph->xaxis->title->SetColor('white');
$graph->xaxis->SetFont(FF_FONT1,FS_BOLD);
$graph->xaxis->SetColor('white');
$graph->yaxis->SetFont(FF_FONT1,FS_BOLD);
$graph->yaxis->SetColor('white');
//$graph->ygrid->Show(false);
$graph->ygrid->SetColor('white@0.5');
// Setup graph title
$graph->title->Set('Using alpha blending with a background');
// Some extra margin (from the top)
$graph->title->SetMargin(3);
$graph->title->SetFont(FF_ARIAL,FS_NORMAL,12);
// Create the three var series we will combine
$bplot1 = new BarPlot($datay1);
$bplot2 = new BarPlot($datay2);
$bplot3 = new BarPlot($datay3);
// Setup the colors with 40% transparency (alpha channel)
$bplot1->SetFillColor('orange@0.4');
$bplot2->SetFillColor('brown@0.4');
$bplot3->SetFillColor('darkgreen@0.4');
// Setup legends
$bplot1->SetLegend('Label 1');
$bplot2->SetLegend('Label 2');
$bplot3->SetLegend('Label 3');
// Setup each bar with a shadow of 50% transparency
$bplot1->SetShadow('black@0.4');
$bplot2->SetShadow('black@0.4');
$bplot3->SetShadow('black@0.4');
$gbarplot = new GroupBarPlot(array($bplot1,$bplot2,$bplot3));
$gbarplot->SetWidth(0.6);
$graph->Add($gbarplot);
$graph->Stroke();
?>