Follow


高性能なグラフ生成ライブラリ
PHP5、PHP7、PHP8対応の高機能なグラフ生成ライブラリ
20種類以上の豊富なプロット形式をサポート
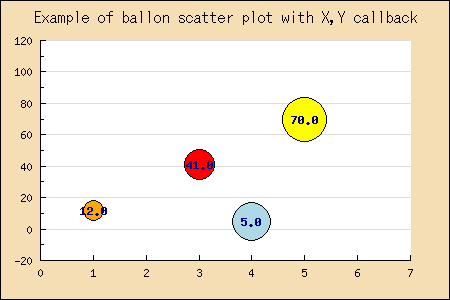
JpGraph サンプル
← 一覧に戻るballoonex2.php
<?php // content="text/plain; charset=utf-8"
require_once ("jpgraph/jpgraph.php");
require_once ("jpgraph/jpgraph_scatter.php");

// Each ballon is specificed by four values.
// (X,Y,Size,Color)
$data = array(
    array(1,12,10,'orange'),
    array(3,41,15,'red'),
    array(4,5,19,'lightblue'),
    array(5,70,22,'yellow')
);


// We need to create X,Y data vectors suitable for the
// library from the above raw data.
$n = count($data);
for( $i=0; $i < $n; ++$i ) {

    $datax[$i] = $data[$i][0];
    $datay[$i] = $data[$i][1];

    // Create a faster lookup array so we don't have to search
    // for the correct values in the callback function
    $format[strval($datax[$i])][strval($datay[$i])] = array($data[$i][2],$data[$i][3]);

}


// Callback for markers
// Must return array(width,border_color,fill_color,filename,imgscale)
// If any of the returned values are '' then the
// default value for that parameter will be used (possible empty)
function FCallback($aYVal,$aXVal) {
    global $format;
    return array($format[strval($aXVal)][strval($aYVal)][0],'',
		 $format[strval($aXVal)][strval($aYVal)][1],'','');
}

// Setup a basic graph
$graph = new Graph(450,300,'auto');
$graph->SetScale("intlin");
$graph->SetMargin(40,40,40,40);
$graph->SetMarginColor('wheat');

$graph->title->Set("Example of ballon scatter plot with X,Y callback");
$graph->title->SetFont(FF_ARIAL,FS_BOLD,12);
$graph->title->SetMargin(10);

// Use a lot of grace to get large scales since the ballon have
// size and we don't want them to collide with the X-axis
$graph->yaxis->scale->SetGrace(50,10);
$graph->xaxis->scale->SetGrace(50,10);

// Make sure X-axis as at the bottom of the graph and not at the default Y=0
$graph->xaxis->SetPos('min');

// Set X-scale to start at 0
$graph->xscale->SetAutoMin(0);

// Create the scatter plot
$sp1 = new ScatterPlot($datay,$datax);
$sp1->mark->SetType(MARK_FILLEDCIRCLE);

// Uncomment the following two lines to display the values
$sp1->value->Show();
$sp1->value->SetFont(FF_FONT1,FS_BOLD);

// Specify the callback
$sp1->mark->SetCallbackYX("FCallback");

// Add the scatter plot to the graph
$graph->Add($sp1);

// ... and send to browser
$graph->Stroke();

?>