Follow


高性能なグラフ生成ライブラリ
PHP5、PHP7、PHP8対応の高機能なグラフ生成ライブラリ
20種類以上の豊富なプロット形式をサポート
JpGraph サンプル
← 一覧に戻るbar2scalesex1.php
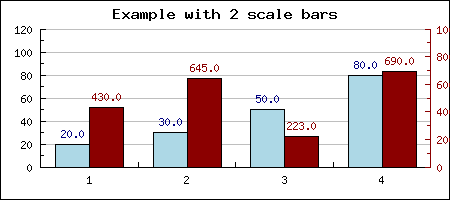
<?php // content="text/plain; charset=utf-8"
require_once ("jpgraph/jpgraph.php");
require_once ("jpgraph/jpgraph_bar.php");

$datay=array(20,30,50,80);
$datay2=array(430,645,223,690);
$datazero=array(0,0,0,0);

// Create the graph.
$graph = new Graph(450,200);
$graph->title->Set('Example with 2 scale bars');

// Setup Y and Y2 scales with some "grace"
$graph->SetScale("textlin");
$graph->SetY2Scale("lin");
$graph->yaxis->scale->SetGrace(30);
$graph->y2axis->scale->SetGrace(30);

//$graph->ygrid->Show(true,true);
$graph->ygrid->SetColor('gray','lightgray@0.5');

// Setup graph colors
$graph->SetMarginColor('white');
$graph->y2axis->SetColor('darkred');


// Create the "dummy" 0 bplot
$bplotzero = new BarPlot($datazero);

// Create the "Y" axis group
$ybplot1 = new BarPlot($datay);
$ybplot1->value->Show();
$ybplot = new GroupBarPlot(array($ybplot1,$bplotzero));

// Create the "Y2" axis group
$ybplot2 = new BarPlot($datay2);
$ybplot2->value->Show();
$ybplot2->value->SetColor('darkred');
$ybplot2->SetFillColor('darkred');
$y2bplot = new GroupBarPlot(array($bplotzero,$ybplot2));

// Add the grouped bar plots to the graph
$graph->Add($ybplot);
$graph->AddY2($y2bplot);

// .. and finally stroke the image back to browser
$graph->Stroke();
?>