Follow


高性能なグラフ生成ライブラリ
PHP5、PHP7、PHP8対応の高機能なグラフ生成ライブラリ
20種類以上の豊富なプロット形式をサポート
JpGraph サンプル
← 一覧に戻るbargradex6.php
<?php // content="text/plain; charset=utf-8"
// Example for use of JpGraph,
// ljp, 01/03/01 20:32
require_once ("jpgraph/jpgraph.php");
require_once ("jpgraph/jpgraph_bar.php");
// We need some data
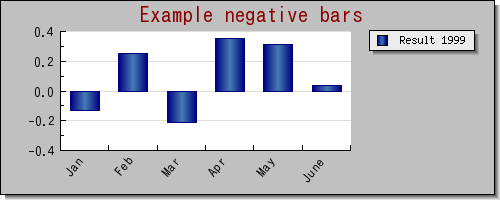
$datay=array(-0.13,0.25,-0.21,0.35,0.31,0.04);
$datax=array("Jan","Feb","Mar","Apr","May","June");
// Setup the graph.
$graph = new Graph(500,200);
$graph->img->SetMargin(60,150,30,50);
$graph->SetScale("textlin");
$graph->SetMarginColor("silver");
$graph->SetShadow();
// Set up the title for the graph
$graph->title->Set("Example negative bars");
$graph->title->SetFont(FF_VERDANA,FS_NORMAL,16);
$graph->title->SetColor("darkred");
// Setup font for axis
$graph->xaxis->SetFont(FF_VERDANA,FS_NORMAL,10);
$graph->yaxis->SetFont(FF_VERDANA,FS_NORMAL,10);
// Show 0 label on Y-axis (default is not to show)
$graph->yscale->ticks->SupressZeroLabel(false);
// Setup X-axis labels
$graph->xaxis->SetTickLabels($datax);
$graph->xaxis->SetLabelAngle(50);
// Set X-axis at the minimum value of Y-axis (default will be at 0)
$graph->xaxis->SetPos("min"); // "min" will position the x-axis at the minimum value of the Y-axis
// Create the bar pot
$bplot = new BarPlot($datay);
$bplot->SetWidth(0.6);
$bplot->SetLegend("Result 1999","blue");
// Setup color for gradient fill style
$bplot->SetFillGradient("navy","steelblue",GRAD_MIDVER);
// Set color for the frame of each bar
$bplot->SetColor("navy");
$graph->Add($bplot);
// Finally send the graph to the browser
$graph->Stroke();
?>