Follow


高性能なグラフ生成ライブラリ
PHP5、PHP7、PHP8対応の高機能なグラフ生成ライブラリ
20種類以上の豊富なプロット形式をサポート
JpGraph サンプル
← 一覧に戻るbarlinefreqex1.php
<?php // content="text/plain; charset=utf-8"
//
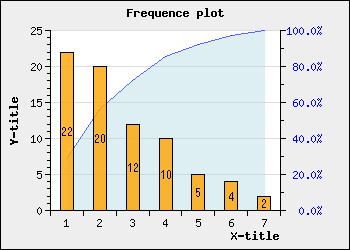
// Example of frequence bar
//
include_once ("jpgraph/jpgraph.php");
include_once ("jpgraph/jpgraph_bar.php");
include_once ("jpgraph/jpgraph_line.php");
// Utility function to calculate the accumulated frequence
// for a set of values and ocurrences
function accfreq($data) {
rsort($data);
$s = array_sum($data);
$as = array($data[0]);
$asp = array(100*$as[0]/$s);
$n = count($data);
for( $i=1; $i < $n; ++$i ) {
$as[$i] = $as[$i-1]+$data[$i];
$asp[$i] = 100.0*$as[$i]/$s;
}
return $asp;
}
// some data
$data_freq = array(22,20,12,10,5,4,2);
$data_accfreq = accfreq($data_freq);
// Create the graph.
$graph = new Graph(350,250);
// Setup some basic graph parameters
$graph->SetScale("textlin");
$graph->SetY2Scale('lin',0,100);
$graph->img->SetMargin(50,70,30,40);
$graph->yaxis->SetTitleMargin(30);
$graph->SetMarginColor('#EEEEEE');
// Setup titles and fonts
$graph->title->Set("Frequence plot");
$graph->xaxis->title->Set("X-title");
$graph->yaxis->title->Set("Y-title");
$graph->title->SetFont(FF_FONT1,FS_BOLD);
$graph->yaxis->title->SetFont(FF_FONT1,FS_BOLD);
$graph->xaxis->title->SetFont(FF_FONT1,FS_BOLD);
// Turn the tickmarks
$graph->xaxis->SetTickSide(SIDE_DOWN);
$graph->yaxis->SetTickSide(SIDE_LEFT);
$graph->y2axis->SetTickSide(SIDE_RIGHT);
$graph->y2axis->SetColor('black','blue');
$graph->y2axis->SetLabelFormat('%3d.0%%');
// Create a bar pot
$bplot = new BarPlot($data_freq);
// Create accumulative graph
$lplot = new LinePlot($data_accfreq);
// We want the line plot data point in the middle of the bars
$lplot->SetBarCenter();
// Use transperancy
$lplot->SetFillColor('lightblue@0.6');
$lplot->SetColor('blue@0.6');
$graph->AddY2($lplot);
// Setup the bars
$bplot->SetFillColor("orange@0.2");
$bplot->SetValuePos('center');
$bplot->value->SetFormat("%d");
$bplot->value->SetFont(FF_ARIAL,FS_NORMAL,9);
$bplot->value->Show();
// Add it to the graph
$graph->Add($bplot);
// Send back the HTML page which will call this script again
// to retrieve the image.
$graph->Stroke();
?>