Follow


高性能なグラフ生成ライブラリ
PHP5、PHP7、PHP8対応の高機能なグラフ生成ライブラリ
20種類以上の豊富なプロット形式をサポート
JpGraph サンプル
← 一覧に戻るbartutex12.php
<?php // content="text/plain; charset=utf-8"
// A medium complex example of JpGraph
// Note: You can create a graph in far fewwr lines of code if you are
// willing to go with the defaults. This is an illustrative example of
// some of the capabilities of JpGraph.
require_once ("jpgraph/jpgraph.php");
require_once ("jpgraph/jpgraph_line.php");
require_once ("jpgraph/jpgraph_bar.php");
$month=array(
"Jan","Feb","Mar","Apr","Maj","Jun","Jul","Aug","Sep","Okt","Nov","Dec");
// Create some datapoints
$steps=100;
for($i=0; $i<$steps; ++$i) {
$databarx[]=sprintf("198%d %s",floor($i/12),$month[$i%12]);
$datay[$i]=log(pow($i,$i/10)+1)*sin($i/15)+35;
if( $i % 6 == 0 && $i<$steps-6) {
$databary[]=abs(25*sin($i)+5);
}
else {
$databary[]=0;
}
}
// New graph with a background image and drop shadow
$graph = new Graph(450,300);
$graph->SetBackgroundImage("tiger_bkg.png",BGIMG_FILLFRAME);
$graph->SetShadow();
// Use text X-scale so we can text labels on the X-axis
$graph->SetScale("textlin");
// Y2-axis is linear
$graph->SetY2Scale("lin");
// Color the two Y-axis to make them easier to associate
// to the corresponding plot (we keep the axis black though)
$graph->yaxis->SetColor("black","red");
$graph->y2axis->SetColor("black","orange");
// Set title and subtitle
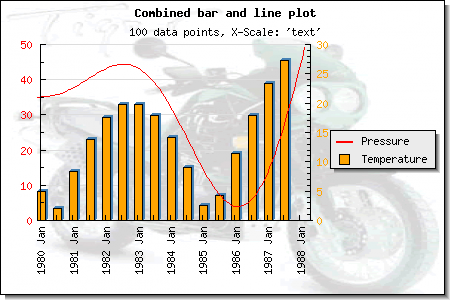
$graph->title->Set("Combined bar and line plot");
$graph->subtitle->Set("100 data points, X-Scale: 'text'");
// Use built in font (don't need TTF support)
$graph->title->SetFont(FF_FONT1,FS_BOLD);
// Make the margin around the plot a little bit bigger then default
$graph->img->SetMargin(40,140,40,80);
// Slightly adjust the legend from it's default position in the
// top right corner to middle right side
$graph->legend->Pos(0.03,0.5,"right","center");
// Display every 6:th tickmark
$graph->xaxis->SetTextTickInterval(6);
// Label every 2:nd tick mark
$graph->xaxis->SetTextLabelInterval(2);
// Setup the labels
$graph->xaxis->SetTickLabels($databarx);
$graph->xaxis->SetLabelAngle(90);
// Create a red line plot
$p1 = new LinePlot($datay);
$p1->SetColor("red");
$p1->SetLegend("Pressure");
// Create the bar plot
$b1 = new BarPlot($databary);
$b1->SetLegend("Temperature");
$b1->SetFillColor("orange");
$b1->SetAbsWidth(8);
// Drop shadow on bars adjust the default values a little bit
$b1->SetShadow("steelblue",2,2);
// The order the plots are added determines who's ontop
$graph->Add($p1);
$graph->AddY2($b1);
// Finally output the image
$graph->Stroke();
?>