Follow


高性能なグラフ生成ライブラリ
PHP5、PHP7、PHP8対応の高機能なグラフ生成ライブラリ
20種類以上の豊富なプロット形式をサポート
JpGraph サンプル
← 一覧に戻るbezierex1.php
<?php // content="text/plain; charset=utf-8"
require_once ('jpgraph/jpgraph.php');
require_once ('jpgraph/jpgraph_line.php');
require_once ('jpgraph/jpgraph_scatter.php');
require_once ('jpgraph/jpgraph_regstat.php');
// Original data points
$xdata = array(1,3,12,15);
$ydata = array(5,15,2,19);
// Get the interpolated values by creating
// a new Spline object.
$bez = new Bezier($xdata,$ydata);
// For the new data set we want 40 points to
// get a smooth curve.
list($newx,$newy) = $bez->Get(50);
// Create the graph
$g = new Graph(300,200);
$g->SetMargin(30,20,40,30);
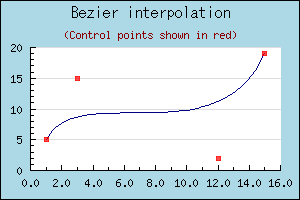
$g->title->Set("Bezier interpolation");
$g->title->SetFont(FF_ARIAL,FS_NORMAL,12);
$g->subtitle->Set('(Control points shown in red)');
$g->subtitle->SetColor('darkred');
$g->SetMarginColor('lightblue');
//$g->img->SetAntiAliasing();
// We need a linlin scale since we provide both
// x and y coordinates for the data points.
$g->SetScale('linlin');
// We want 1 decimal for the X-label
$g->xaxis->SetLabelFormat('%1.1f');
// We use a scatterplot to illustrate the original
// contro points.
$bplot = new ScatterPlot($ydata,$xdata);
$bplot->mark->SetFillColor('red@0.3');
$bplot->mark->SetColor('red@0.5');
// And a line plot to stroke the smooth curve we got
// from the original control points
$lplot = new LinePlot($newy,$newx);
$lplot->SetColor('navy');
// Add the plots to the graph and stroke
$g->Add($lplot);
$g->Add($bplot);
$g->Stroke();
?>