Follow


高性能なグラフ生成ライブラリ
PHP5、PHP7、PHP8対応の高機能なグラフ生成ライブラリ
20種類以上の豊富なプロット形式をサポート
JpGraph サンプル
← 一覧に戻るcanvas_jpgarchex.php
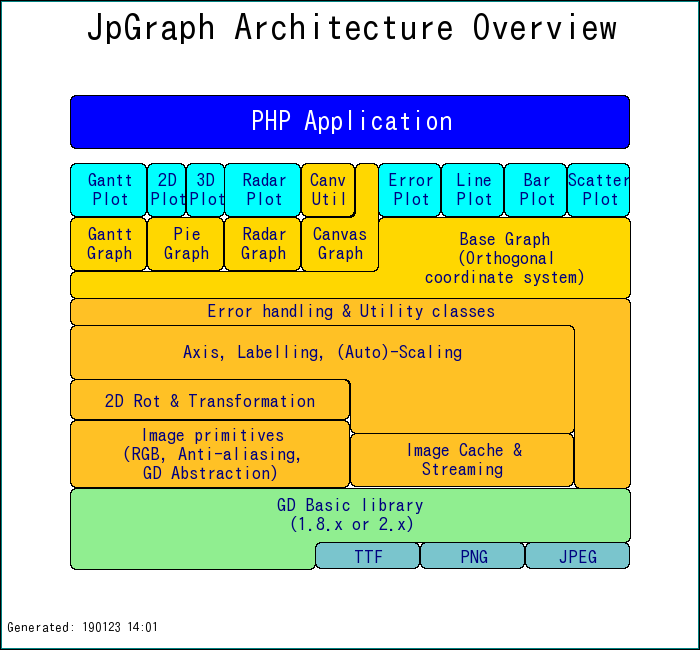
<?php // content="text/plain; charset=utf-8"
// $Id: canvas_jpgarchex.php,v 1.3 2002/08/29 10:14:19 aditus Exp $
include "jpgraph/jpgraph.php";
include "jpgraph/jpgraph_canvas.php";
include "jpgraph/jpgraph_canvtools.php";

// Scale we are using
$ymax=24;
$xmax=20;

// Setup the basic canvas
$g = new CanvasGraph(700,650,'auto');
$g->SetMargin(2,3,2,3);
$g->SetMarginColor("teal");
$g->InitFrame();

// ... and a scale
$scale = new CanvasScale($g);
$scale->Set(0,$xmax,0,$ymax);

// ... we need shape since we want the indented rectangle
$shape = new Shape($g,$scale);
$shape->SetColor('black');

// ... basic parameters for the overall image
$l = 2;		// Left margin
$r = 18;	// Row number to start the lowest line on
$width = 16;	// Total width

// Setup the two basic rectangle text object we  will use
$tt = new CanvasRectangleText();
$tt->SetFont(FF_ARIAL,FS_NORMAL,14);
$tt->SetFillColor('');
$tt->SetColor('');
$tt->SetFontColor('navy');

$t = new CanvasRectangleText();
$t->SetFont(FF_ARIAL,FS_NORMAL,14);
$t->SetFillColor('goldenrod1');
$t->SetFontColor('navy');


// Now start drawing the arch overview from the bottom and up
// This is all pretty manual and one day I will write a proper
// framework to make it easy to construct these types of architecture
// overviews. But for now, just plain old coordinates..

// Line: GD Library and image libraries
$h=3;
$s  = 3; $d=$l + $width-9;
$t->SetFillColor('cadetblue3');
$t->Set("TTF",$d,$r+2,$s,1);
$t->Stroke($g->img,$scale);
$t->Set("PNG",$d+$s,$r+2,$s,1);
$t->Stroke($g->img,$scale);
$t->Set("JPEG",$d+2*$s,$r+2,$s,1);
$t->Stroke($g->img,$scale);
$shape->IndentedRectangle($l,$r,$width,$h,$s*3,1,2,'lightgreen');
$tt->Set("GD Basic library\n(1.8.x or 2.x)",$l,$r,$width,$h-1);
$tt->Stroke($g->img,$scale);


// Area: Basic internal JpGraph architecture
$t->SetFillColor('goldenrod1');
$h = 2;
$r -= $h; $d=8;
$t->Set("Image primitives\n(RGB, Anti-aliasing,\nGD Abstraction)",$l,$r-0.5,$width*0.5,$h+0.5);
$t->Stroke($g->img,$scale);
$t->Set("Image Cache &\nStreaming",$l+0.5*$width,$r,$width*0.4,$h);
$t->Stroke($g->img,$scale);

$r -= $h; $d=8;
$t->Set("2D Rot & Transformation",$l,$r,$width*0.5,$h-0.5); $t->Stroke($g->img,$scale);


$r -= 2; $h = 4;
$shape->IndentedRectangle($l,$r,$width*0.9,$h,$d,2,3,'goldenrod1');
$tt->Set("Axis, Labelling, (Auto)-Scaling",$l,$r,$width*0.9,$h-2); $tt->Stroke($g->img,$scale);

$r -= 1;
$shape->IndentedRectangle($l,$r,$width,7,$width*0.9,6,3,'goldenrod1');
$tt->Set("Error handling & Utility classes",$l,$r,$width,1); $tt->Stroke($g->img,$scale);


// Area: Top area with graph components
$t->SetFillColor('gold1');
$r -= 3;
$w = $width*0.55/4; $h = 2;
$t->Set("Gantt\nGraph",$l,$r,$w,$h);
$t->Stroke($g->img,$scale);

$t->Set("Pie\nGraph",$l+$w,$r,$w,$h);
$t->Stroke($g->img,$scale);
$t->Set("Radar\nGraph",$l+$w*2,$r,$w,$h);
$t->Stroke($g->img,$scale);

$shape->IndentedRectangle($l,$r,$width,3,4*$w,2,0,'gold1');
$tt->Set("Base Graph\n(Orthogonal\ncoordinate system)",$l+4*$w,$r,$width-$w*4,3);
$tt->Stroke($g->img,$scale);

$r -= 2;
$d = 0.7;
$shape->IndentedRectangle($l+3*$w,$r,$w,4, $w*$d,2,0,'gold1');
$t->Set("Canv\nUtil",$l+3*$w,$r,$w*$d,$h);     $t->Stroke($g->img,$scale);
$tt->Set("Canvas\nGraph",$l+3*$w,$r+2,$w,2); $tt->Stroke($g->img,$scale);

// Top line of plotting plugins
$t->SetFillColor('cyan');
$t->Set("Gantt\nPlot",$l,$r,$w,$h); $t->Stroke($g->img,$scale);
$t->Set("2D\nPlot",$l+$w,$r,$w/2,$h);     $t->Stroke($g->img,$scale);
$t->Set("3D\nPlot",$l+$w+$w/2,$r,$w/2,$h);$t->Stroke($g->img,$scale);
$t->Set("Radar\nPlot",$l+2*$w,$r,$w,$h); $t->Stroke($g->img,$scale);

$wp = ($width - 4*$w)/4;
$t->Set("Error\nPlot",$l+4*$w,$r,$wp,$h); $t->Stroke($g->img,$scale);
$t->Set("Line\nPlot",$l+4*$w+$wp,$r,$wp,$h); $t->Stroke($g->img,$scale);
$t->Set("Bar\nPlot",$l+4*$w+2*$wp,$r,$wp,$h); $t->Stroke($g->img,$scale);
$t->Set("Scatter\nPlot",$l+4*$w+3*$wp,$r,$wp,$h); $t->Stroke($g->img,$scale);

// Show application top
$r -= 2.5; $h=2;
$t->SetFillColor('blue');
$t->SetFontColor('white');
$t->SetFont(FF_ARIAL,FS_BOLD,20);
$t->Set("PHP Application",$l,$r,$width,$h); $t->Stroke($g->img,$scale);

// Stroke title
$r = 0.5;
$tt->SetFontColor('black');
$tt->SetFont(FF_TIMES,FS_BOLD,28);
$tt->Set("JpGraph Architecture Overview",$l,$r,$width,1);
$tt->Stroke($g->img,$scale);

// Stroke footer
$tt->SetFont(FF_VERDANA,FS_NORMAL,10);
$tt->Set("Generated: ".date("ymd H:m",time()),0.1,$ymax*0.95);
$tt->Stroke($g->img,$scale);

// .. and stream it all back
$g->Stroke();

?>