Follow


高性能なグラフ生成ライブラリ
PHP5、PHP7、PHP8対応の高機能なグラフ生成ライブラリ
20種類以上の豊富なプロット形式をサポート
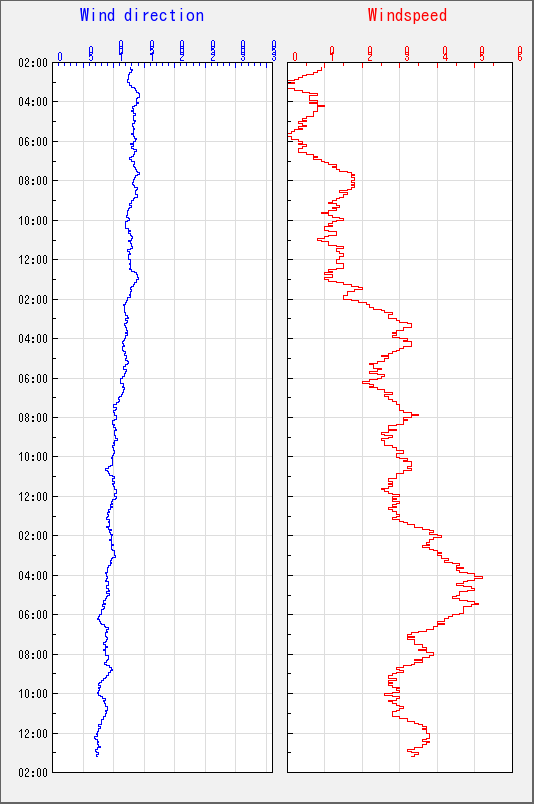
JpGraph サンプル
← 一覧に戻るcomb90dategraphex02.php
<?php // content="text/plain; charset=utf-8"
require_once("jpgraph/jpgraph.php");
require_once("jpgraph/jpgraph_line.php");
require_once("jpgraph/jpgraph_date.php");
require_once("jpgraph/jpgraph_mgraph.php");

// Setup some fake data to simulate some wind speed and direction

DEFINE('NDATAPOINTS',420);
DEFINE('SAMPLERATE',300);
$start = time();
$end = $start+NDATAPOINTS*SAMPLERATE;
$data = array();
$xdata = array();
$data_winddirection[0] = rand(100,200);
$data_windspeed[0] = rand(7,10);
for( $i=0; $i < NDATAPOINTS-1; ++$i ) {
    $data_winddirection[$i+1] = $data_winddirection[$i] + rand(-4,4);
    if($data_winddirection[$i+1] < 0 || $data_winddirection[$i+1] > 359)
        $data_winddirection[$i+1] = 0;

    $data_windspeed[$i+1] = $data_windspeed[$i] + rand(-2,2);
    if($data_windspeed[$i+1] < 0 )
        $data_windspeed[$i+1] = 0;

    $xdata[$i] = $start + $i * SAMPLERATE;
}
$xdata[$i] = $start + $i * SAMPLERATE;


DEFINE('BKG_COLOR','lightgray:1.7');
DEFINE('WIND_HEIGHT',800);
DEFINE('WIND_WIDTH',280);

// Setup the Wind direction graph
$graph = new Graph(WIND_WIDTH,WIND_HEIGHT);
$graph->SetMarginColor(BKG_COLOR);
$graph->SetScale('datlin',0,360);
$graph->Set90AndMargin(50,10,60,30);
$graph->SetFrame(true,'white',0);
$graph->SetBox();

$graph->title->Set('Wind direction');
$graph->title->SetColor('blue');
$graph->title->SetFont(FF_ARIAL,FS_BOLD,14);
$graph->title->SetMargin(5);

$graph->xaxis->SetFont(FF_ARIAL,FS_NORMAL,9);
$graph->xaxis->scale->SetDateFormat('h:i');
$graph->xgrid->Show();

$graph->yaxis->SetLabelAngle(90);
$graph->yaxis->SetColor('blue');
$graph->yaxis->SetFont(FF_ARIAL,FS_NORMAL,9);
$graph->yaxis->SetLabelMargin(0);
$graph->yaxis->scale->SetAutoMin(0);

$line = new LinePlot($data_winddirection,$xdata);
$line->SetStepStyle();
$line->SetColor('blue');

$graph->Add($line);

// Setup the wind speed graph
$graph2 = new Graph(WIND_WIDTH-30,WIND_HEIGHT);
$graph2->SetScale('datlin');
$graph2->Set90AndMargin(5,20,60,30);
$graph2->SetMarginColor(BKG_COLOR);
$graph2->SetFrame(true,'white',0);
$graph2->SetBox();

$graph2->title->Set('Windspeed');
$graph2->title->SetColor('red');
$graph2->title->SetFont(FF_ARIAL,FS_BOLD,14);
$graph2->title->SetMargin(5);

$graph2->xaxis->HideLabels();
$graph2->xgrid->Show();

$graph2->yaxis->SetLabelAngle(90);
$graph2->yaxis->SetColor('red');
$graph2->yaxis->SetFont(FF_ARIAL,FS_NORMAL,9);
$graph2->yaxis->SetLabelMargin(0);
$graph2->yaxis->scale->SetAutoMin(0);

$line2 = new LinePlot($data_windspeed,$xdata);
$line2->SetStepStyle();
$line2->SetColor('red');

$graph2->Add($line2);

//-----------------------
// Create a multigraph
//----------------------
$mgraph = new MGraph();
$mgraph->SetMargin(2,2,2,2);
$mgraph->SetFrame(true,'darkgray',2);
$mgraph->SetFillColor(BKG_COLOR);
$mgraph->Add($graph);
$mgraph->Add($graph2,280,0);
$mgraph->Stroke();

?>