Follow


高性能なグラフ生成ライブラリ
PHP5、PHP7、PHP8対応の高機能なグラフ生成ライブラリ
20種類以上の豊富なプロット形式をサポート
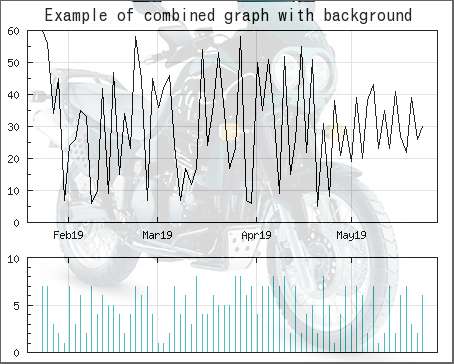
JpGraph サンプル
← 一覧に戻るcombgraphex2.php
<?php // content="text/plain; charset=utf-8"

require_once ("jpgraph/jpgraph.php");
require_once ("jpgraph/jpgraph_mgraph.php");
require_once ("jpgraph/jpgraph_line.php");
require_once ("jpgraph/jpgraph_bar.php");
require_once ("jpgraph/jpgraph_utils.inc.php");

//------------------------------------------------------------------
// Create some random data for the plot. We use the current time for the
// first X-position
//------------------------------------------------------------------
$datay = array();
$datax = array();
$ts = time();
$n=70; // Number of data points
for($i=0; $i < $n; ++$i ) {
    $datax[$i] = $ts+$i*150000;
    $datay[$i] = rand(5,60);
    $datay2[$i] = rand(1,8);
}

// Now get labels at the start of each month
list($tickPositions,$minTickPositions) = DateScaleUtils::getTicks($datax,DSUTILS_MONTH1);

// Now create the real graph
// Combine a line and a bar graph

// We add some grace to the end of the X-axis scale so that the first and last
// data point isn't exactly at the very end or beginning of the scale
$grace = 400000;
$xmin = $datax[0]-$grace;
$xmax = $datax[$n-1]+$grace;;

// Overall width of graphs
$w = 450;
// Left and right margin for each graph
$lm=25; $rm=15;

//----------------------
// Setup the line graph
//----------------------
$graph = new Graph($w,250);
$graph->SetScale('linlin',0,0,$xmin,$xmax);
$graph->SetMargin($lm,$rm,10,30);
$graph->SetMarginColor('white');
$graph->SetFrame(false);
$graph->SetBox(true);
$graph->title->Set('Example of combined graph with background');
$graph->title->SetFont(FF_ARIAL,FS_NORMAL,14);
$graph->xaxis->SetTickPositions($tickPositions,$minTickPositions);
$graph->xaxis->SetLabelFormatString('My',true);
$graph->xgrid->Show();
$p1 = new LinePlot($datay,$datax);
$graph->Add($p1);

//----------------------
// Setup the bar graph
//----------------------
$graph2 = new Graph($w,110);
$graph2->SetScale('linlin',0,0,$xmin,$xmax);
$graph2->SetMargin($lm,$rm,5,10);
$graph2->SetMarginColor('white');
$graph2->SetFrame(false);
$graph2->SetBox(true);
$graph2->xgrid->Show();
$graph2->xaxis->SetTickPositions($tickPositions,$minTickPositions);
$graph2->xaxis->SetLabelFormatString('My',true);
$graph2->xaxis->SetPos('max');
$graph2->xaxis->HideLabels();
$graph2->xaxis->SetTickSide(SIDE_DOWN);
$b1 = new BarPlot($datay2,$datax);
$b1->SetFillColor('teal');
$b1->SetColor('teal:1.2');
$graph2->Add($b1);

//-----------------------
// Create a multigraph
//----------------------


$mgraph = new MGraph();
$mgraph->SetImgFormat('jpeg',60);
$mgraph->SetMargin(2,2,2,2);
$mgraph->SetFrame(true,'darkgray',2);


$mgraph->SetBackgroundImage('tiger1.jpg');
$mgraph->AddMix($graph,0,0,85);


$mgraph->AddMix($graph2,0,250,85);


$mgraph->Stroke();

?>