高性能なグラフ生成ライブラリ
PHP5、PHP7、PHP8対応の高機能なグラフ生成ライブラリ
20種類以上の豊富なプロット形式をサポート
JpGraph サンプル
← 一覧に戻るcontourex02.php

<?php // content="text/plain; charset=utf-8"
// Contour plot example 02

require_once ("jpgraph/jpgraph.php");
require_once ("jpgraph/jpgraph_contour.php");

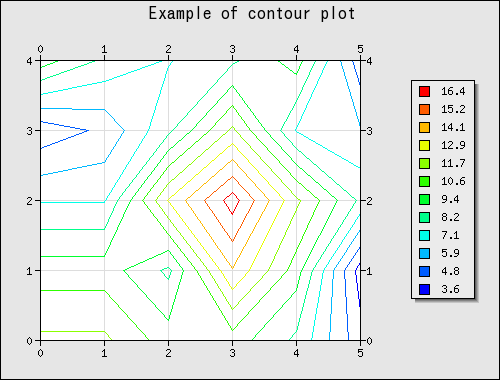
$data = array(
    array (12,12,10,10,8,4),
    array (10,10,8,14,10,3),
    array (7,7,13,17,12,8),
    array (4,5,8,12,7,6),
    array (10,8,7,8,10,4));

// Setup a basic graph context with some generous margins to be able
// to fit the legend
$graph = new Graph(500,380);
$graph->SetMargin(40,140,60,40);

$graph->title->Set("Example of contour plot");
$graph->title->SetFont(FF_ARIAL,FS_BOLD,14);

// For contour plots it is custom to use a box style ofr the axis
$graph->legend->SetPos(0.05,0.5,'right','center');
$graph->SetScale('intint');
$graph->SetAxisStyle(AXSTYLE_BOXOUT);
$graph->xgrid->Show();
$graph->ygrid->Show();


// A simple contour plot with 12 isobar lines and flipped Y-coordinates
$cp = new ContourPlot($data,12,true);

// Display the legend
$cp->ShowLegend();

// Make the isobar lines slightly thicker
$graph->Add($cp);

// ... and send the graph back to the browser
$graph->Stroke();

?>
