Follow


高性能なグラフ生成ライブラリ
PHP5、PHP7、PHP8対応の高機能なグラフ生成ライブラリ
20種類以上の豊富なプロット形式をサポート
JpGraph サンプル
← 一覧に戻るcontourex05.php
<?php // content="text/plain; charset=utf-8"
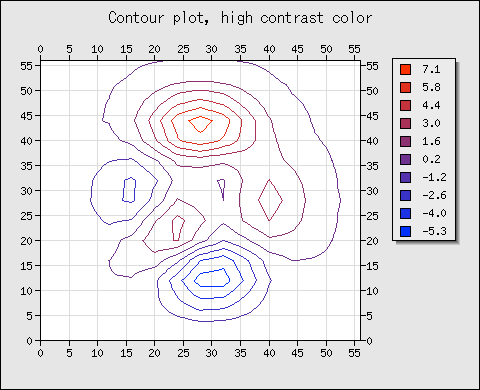
// Contour example 05
require_once ("jpgraph/jpgraph.php");
require_once ("jpgraph/jpgraph_contour.php");
$data = array(
array(0.000,0.001,0.002,0.005,-0.003,-0.053,-0.156,-0.245,-0.235,-0.143,-0.056,-0.014,-0.002,0.000,0.000),
array(0.000,0.002,0.009,0.015,-0.040,-0.308,-0.826,-1.257,-1.188,-0.719,-0.280,-0.070,-0.011,-0.001,0.000),
array(0.001,0.005,0.024,0.047,-0.103,-0.878,-2.432,-3.767,-3.591,-2.166,-0.828,-0.195,-0.026,-0.001,0.000),
array(0.001,0.007,0.046,0.145,0.096,-0.913,-3.472,-6.042,-6.038,-3.625,-1.283,-0.235,-0.005,0.007,0.002),
array(-0.003,-0.009,0.009,0.208,0.734,0.864,-0.937,-3.985,-4.866,-2.781,-0.560,0.194,0.151,0.043,0.007),
array(-0.013,-0.072,-0.229,-0.259,0.652,2.587,3.058,0.661,-1.097,0.014,1.336,1.154,0.474,0.113,0.017),
array(-0.028,-0.171,-0.653,-1.397,-1.091,1.421,3.424,1.942,0.403,1.784,2.986,2.120,0.821,0.191,0.028),
array(-0.037,-0.231,-0.934,-2.255,-2.780,-0.699,1.692,0.981,0.198,2.199,3.592,2.515,0.968,0.225,0.033),
array(-0.031,-0.201,-0.829,-2.076,-2.820,-1.399,0.610,0.408,0.122,1.882,3.004,2.085,0.800,0.186,0.027),
array(-0.018,-0.115,-0.469,-1.133,-1.343,0.011,1.921,2.256,1.824,2.115,2.141,1.312,0.481,0.110,0.016),
array(-0.007,-0.039,-0.130,-0.152,0.560,2.770,5.591,6.719,5.583,3.646,1.973,0.832,0.251,0.052,0.007),
array(-0.001,-0.003,0.024,0.273,1.297,3.628,6.515,7.832,6.517,3.875,1.690,0.546,0.130,0.022,0.003),
array(0.000,0.004,0.036,0.215,0.837,2.171,3.809,4.578,3.810,2.218,0.913,0.268,0.056,0.008,0.001),
array(0.000,0.002,0.014,0.076,0.284,0.721,1.257,1.511,1.257,0.728,0.294,0.083,0.017,0.002,0.000),
array(0.000,0.000,0.003,0.016,0.057,0.144,0.250,0.300,0.250,0.144,0.058,0.016,0.003,0.000,0.000),
);
// Setup a basic graph context with some generous margins to be able
// to fit the legend
$graph = new Graph(480,390);
$graph->SetMargin(40,120,60,50);
$graph->title->Set("Contour plot, high contrast color");
$graph->title->SetFont(FF_ARIAL,FS_BOLD,12);
$graph->title->SetMargin(10);
// For contour plots it is custom to use a box style ofr the axis
$graph->SetScale('intint',0,56,0,56);
// Setup axis and grids
$graph->SetAxisStyle(AXSTYLE_BOXOUT);
$graph->xgrid->Show(true);
$graph->ygrid->Show(true);
// A simple contour plot with 10 isobar lines and flipped Y-coordinates
// Make the data smoother by interpolate the original matrice by a factor of two
// which will make each grid cell half the original size
$cp = new ContourPlot($data,10, 3);
$cp->UseHighContrastColor(true);
// Display the legend
$cp->ShowLegend();
// Make the isobar lines slightly thicker
$graph->Add($cp);
// ... and send the graph back to the browser
$graph->Stroke();
?>