Follow


高性能なグラフ生成ライブラリ
PHP5、PHP7、PHP8対応の高機能なグラフ生成ライブラリ
20種類以上の豊富なプロット形式をサポート
JpGraph サンプル
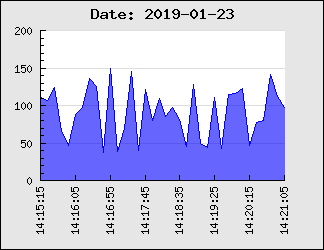
← 一覧に戻るdateaxisex1.php
<?php // content="text/plain; charset=utf-8"
require_once ("jpgraph/jpgraph.php");
require_once ("jpgraph/jpgraph_line.php");

// The callback that converts timestamp to minutes and seconds
function TimeCallback($aVal) {
    return Date('H:i:s',$aVal);
}

// Fake some suitable random data
$now = time();
$datax = array($now);
for( $i=0; $i < 360; $i += 10 ) {
    $datax[] = $now + $i;
}
$n = count($datax);
$datay=array();
for( $i=0; $i < $n; ++$i ) {
    $datay[] = rand(30,150);
}

// Setup the basic graph
$graph = new Graph(324,250);
$graph->SetMargin(40,40,30,70);
$graph->title->Set('Date: '.date('Y-m-d',$now));
$graph->SetAlphaBlending();

// Setup a manual x-scale (We leave the sentinels for the
// Y-axis at 0 which will then autoscale the Y-axis.)
// We could also use autoscaling for the x-axis but then it
// probably will start a little bit earlier than the first value
// to make the first value an even number as it sees the timestamp
// as an normal integer value.
$graph->SetScale("intlin",0,200,$now,$datax[$n-1]);

// Setup the x-axis with a format callback to convert the timestamp
// to a user readable time
$graph->xaxis->SetLabelFormatCallback('TimeCallback');
$graph->xaxis->SetLabelAngle(90);

// Create the line
$p1 = new LinePlot($datay,$datax);
$p1->SetColor("blue");

// Set the fill color partly transparent
$p1->SetFillColor("blue@0.4");

// Add lineplot to the graph
$graph->Add($p1);

// Output line
$graph->Stroke();
?>