Follow


高性能なグラフ生成ライブラリ
PHP5、PHP7、PHP8対応の高機能なグラフ生成ライブラリ
20種類以上の豊富なプロット形式をサポート
JpGraph サンプル
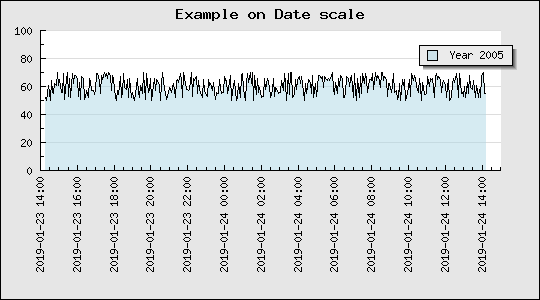
← 一覧に戻るdateaxisex2.php
<?php // content="text/plain; charset=utf-8"
require_once("jpgraph/jpgraph.php");
require_once("jpgraph/jpgraph_line.php");
require_once("jpgraph/jpgraph_date.php");

// Create a data set in range (50,70) and X-positions
DEFINE('NDATAPOINTS',360);
DEFINE('SAMPLERATE',240);
$start = time();
$end = $start+NDATAPOINTS*SAMPLERATE;
$data = array();
$xdata = array();
for( $i=0; $i < NDATAPOINTS; ++$i ) {
    $data[$i] = rand(50,70);
    $xdata[$i] = $start + $i * SAMPLERATE;
}


// Create the new graph
$graph = new Graph(540,300);

// Slightly larger than normal margins at the bottom to have room for
// the x-axis labels
$graph->SetMargin(40,40,30,130);

// Fix the Y-scale to go between [0,100] and use date for the x-axis
$graph->SetScale('datlin',0,100);
$graph->title->Set("Example on Date scale");

// Set the angle for the labels to 90 degrees
$graph->xaxis->SetLabelAngle(90);

$line = new LinePlot($data,$xdata);
$line->SetLegend('Year 2005');
$line->SetFillColor('lightblue@0.5');
$graph->Add($line);
$graph->Stroke();
?>