Follow


高性能なグラフ生成ライブラリ
PHP5、PHP7、PHP8対応の高機能なグラフ生成ライブラリ
20種類以上の豊富なプロット形式をサポート
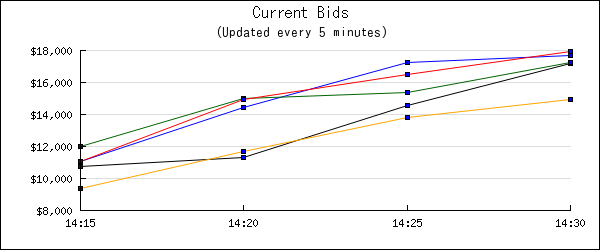
JpGraph サンプル
← 一覧に戻るdatescaleticksex01.php
<?php // content="text/plain; charset=utf-8"
require_once ('jpgraph/jpgraph.php');
require_once ('jpgraph/jpgraph_line.php');
require_once ('jpgraph/jpgraph_date.php');

DEFINE('INTERVAL', 5*60);

// First create some "dummy" data
$m = 5; // Number of data sets
$n = 4; // Number of bids to show
$startbid = 8000;

for( $i=0; $i < $m; ++$i ) {
    $bids[$i] = array($startbid + rand(100,500)*10 );
    for( $j=1; $j < $n; ++$j ) {
        $bids[$i][$j] = $bids[$i][$j-1] + rand(20,500)*10;
    }
}

$start = floor(time()/INTERVAL)*INTERVAL;
$times = array($start);
for( $i=1; $i < $n; ++$i ) {
    // Create a timestamp for every 5 minutes
    $times[$i] = $times[$i-1]+INTERVAL;
}

// Setup the bid graph
$graph = new Graph(600,250);
$graph->SetMargin(80,30,50,40);
$graph->SetMarginColor('white');
$graph->SetScale('dateint');
$graph->title->Set('Current Bids');
$graph->title->SetFont(FF_ARIAL,FS_BOLD,12);
$graph->subtitle->Set('(Updated every 5 minutes)');
$graph->subtitle->SetFont(FF_ARIAL,FS_ITALIC,10);

// Enable antialias
$graph->img->SetAntiAliasing();

// Setup the y-axis to show currency values
$graph->yaxis->SetLabelFormatCallback('number_format');
$graph->yaxis->SetLabelFormat('$%s');

//Use hour:minute format for the labels
$graph->xaxis->scale->SetDateFormat('H:i');

// Force labels to only be displayed every 5 minutes
$graph->xaxis->scale->ticks->Set(INTERVAL);

// Adjust the start time for an "even" 5 minute, i.e. 5,10,15,20,25, ...
$graph->xaxis->scale->SetTimeAlign(MINADJ_5);

// Create the plots using the dummy data created at the beginning
$line = array();
for( $i=0; $i < $m; ++$i ) {
    $line[$i] = new LinePlot($bids[$i],$times);
    $line[$i]->mark->SetType(MARK_SQUARE);
}
$graph->Add($line);

// Send the graph back to the client
$graph->Stroke();
?>