Follow


高性能なグラフ生成ライブラリ
PHP5、PHP7、PHP8対応の高機能なグラフ生成ライブラリ
20種類以上の豊富なプロット形式をサポート
JpGraph サンプル
← 一覧に戻るdateutilex01.php
<?php // content="text/plain; charset=utf-8"
require_once ('jpgraph/jpgraph.php');
require_once ('jpgraph/jpgraph_line.php');
require_once ('jpgraph/jpgraph_utils.inc.php');
// Get a dataset stored in $xdata and $ydata
require_once ('dataset01.inc.php');
$dateUtils = new DateScaleUtils();
// Setup a basic graph
$width=500; $height=300;
$graph = new Graph($width, $height);
// We set the x-scale min/max values to avoid empty space
// on the side of the plot
$graph->SetScale('intlin',0,0,min($xdata),max($xdata));
$graph->SetMargin(60,20,40,60);
// Setup the titles
$graph->title->SetFont(FF_ARIAL,FS_BOLD,12);
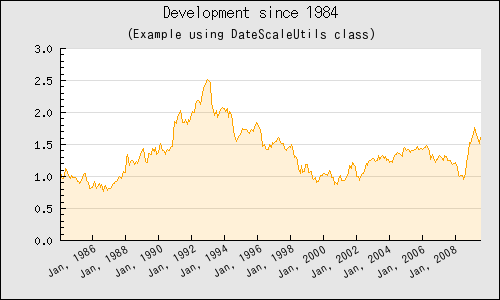
$graph->title->Set('Development since 1984');
$graph->subtitle->SetFont(FF_ARIAL,FS_ITALIC,10);
$graph->subtitle->Set('(Example using DateScaleUtils class)');
// Setup the labels to be correctly format on the X-axis
$graph->xaxis->SetFont(FF_ARIAL,FS_NORMAL,8);
$graph->xaxis->SetLabelAngle(30);
// The second paramter set to 'true' will make the library interpret the
// format string as a date format. We use a Month + Year format
$graph->xaxis->SetLabelFormatString('M, Y',true);
// Get manual tick every second year
list($tickPos,$minTickPos) = $dateUtils->getTicks($xdata,DSUTILS_YEAR2);
$graph->xaxis->SetTickPositions($tickPos,$minTickPos);
// First add an area plot
$lp1 = new LinePlot($ydata,$xdata);
$lp1->SetWeight(0);
$lp1->SetFillColor('orange@0.85');
$graph->Add($lp1);
// And then add line. We use two plots in order to get a
// more distinct border on the graph
$lp2 = new LinePlot($ydata,$xdata);
$lp2->SetColor('orange');
$graph->Add($lp2);
// And send back to the client
$graph->Stroke();
?>