Follow


高性能なグラフ生成ライブラリ
PHP5、PHP7、PHP8対応の高機能なグラフ生成ライブラリ
20種類以上の豊富なプロット形式をサポート
JpGraph サンプル
← 一覧に戻るexample11.php
<?php // content="text/plain; charset=utf-8"
require_once ("jpgraph/jpgraph.php");
require_once ("jpgraph/jpgraph_line.php");
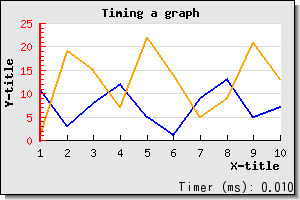
$ydata = array(11,3,8,12,5,1,9,13,5,7);
$ydata2 = array(1,19,15,7,22,14,5,9,21,13);
$timer = new JpgTimer();
$timer->Push();
// Create the graph. These two calls are always required
$graph = new Graph(300,200);
$graph->SetScale("textlin");
$graph->SetMargin(40,20,20,60);
$graph->title->Set("Timing a graph");
$graph->footer->right->Set('Timer (ms): ');
$graph->footer->right->SetFont(FF_COURIER,FS_ITALIC);
$graph->footer->SetTimer($timer);
// Create the linear plot
$lineplot=new LinePlot($ydata);
$lineplot2=new LinePlot($ydata2);
// Add the plot to the graph
$graph->Add($lineplot);
$graph->Add($lineplot2);
$graph->xaxis->title->Set("X-title");
$graph->yaxis->title->Set("Y-title");
$graph->title->SetFont(FF_FONT1,FS_BOLD);
$graph->yaxis->title->SetFont(FF_FONT1,FS_BOLD);
$graph->xaxis->title->SetFont(FF_FONT1,FS_BOLD);
$lineplot->SetColor("blue");
$lineplot->SetWeight(2);
$lineplot2->SetColor("orange");
$lineplot2->SetWeight(2);
$graph->yaxis->SetColor("red");
$graph->yaxis->SetWeight(2);
$graph->SetShadow();
// Display the graph
$graph->Stroke();
?>