Follow


高性能なグラフ生成ライブラリ
PHP5、PHP7、PHP8対応の高機能なグラフ生成ライブラリ
20種類以上の豊富なプロット形式をサポート
JpGraph サンプル
← 一覧に戻るexample16.1.php
<?php // content="text/plain; charset=utf-8"
require_once ("jpgraph/jpgraph.php");
require_once ("jpgraph/jpgraph_line.php");
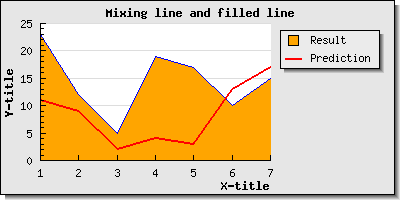
$l1datay = array(11,9,2,4,3,13,17);
$l2datay = array(23,12,5,19,17,10,15);
$datax=array('Jan','Feb','Mar','Apr','May');
// Create the graph.
$graph = new Graph(400,200);
$graph->SetScale('textlin');
$graph->img->SetMargin(40,130,20,40);
$graph->SetShadow();
// Create the linear error plot
$l1plot=new LinePlot($l1datay);
$l1plot->SetColor('red');
$l1plot->SetWeight(2);
$l1plot->SetLegend('Prediction');
// Create the bar plot
$l2plot = new LinePlot($l2datay);
$l2plot->SetFillColor('orange');
$l2plot->SetLegend('Result');
// Add the plots to the graph
$graph->Add($l2plot);
$graph->Add($l1plot);
$graph->title->Set('Mixing line and filled line');
$graph->xaxis->title->Set('X-title');
$graph->yaxis->title->Set('Y-title');
$graph->title->SetFont(FF_FONT1,FS_BOLD);
$graph->yaxis->title->SetFont(FF_FONT1,FS_BOLD);
$graph->xaxis->title->SetFont(FF_FONT1,FS_BOLD);
//$graph->xaxis->SetTickLabels($datax);
//$graph->xaxis->SetTextTickInterval(2);
// Display the graph
$graph->Stroke();
?>