Follow


高性能なグラフ生成ライブラリ
PHP5、PHP7、PHP8対応の高機能なグラフ生成ライブラリ
20種類以上の豊富なプロット形式をサポート
JpGraph サンプル
← 一覧に戻るexample16.6.php
<?php // content="text/plain; charset=utf-8"
require_once ("jpgraph/jpgraph.php");
require_once ("jpgraph/jpgraph_scatter.php");
require_once ("jpgraph/jpgraph_line.php");
require_once ("jpgraph/jpgraph_utils.inc.php");
// Create some "fake" regression data
$datay = array();
$datax = array();
$a= 3.2;
$b= 2.5;
for($x=0; $x < 20; ++$x) {
$datax[$x] = $x;
$datay[$x] = $a + $b*$x + rand(-20,20);
}
$lr = new LinearRegression($datax, $datay);
list( $stderr, $corr ) = $lr->GetStat();
list( $xd, $yd ) = $lr->GetY(0,19);
// Create the graph
$graph = new Graph(300,250);
$graph->SetScale('linlin');
// Setup title
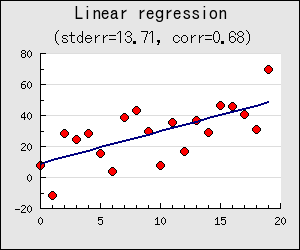
$graph->title->Set("Linear regression");
$graph->title->SetFont(FF_ARIAL,FS_BOLD,14);
$graph->subtitle->Set('(stderr='.sprintf('%.2f',$stderr).', corr='.sprintf('%.2f',$corr).')');
$graph->subtitle->SetFont(FF_ARIAL,FS_NORMAL,12);
// make sure that the X-axis is always at the
// bottom at the plot and not just at Y=0 which is
// the default position
$graph->xaxis->SetPos('min');
// Create the scatter plot with some nice colors
$sp1 = new ScatterPlot($datay,$datax);
$sp1->mark->SetType(MARK_FILLEDCIRCLE);
$sp1->mark->SetFillColor("red");
$sp1->SetColor("blue");
$sp1->SetWeight(3);
$sp1->mark->SetWidth(4);
// Create the regression line
$lplot = new LinePlot($yd);
$lplot->SetWeight(2);
$lplot->SetColor('navy');
// Add the pltos to the line
$graph->Add($sp1);
$graph->Add($lplot);
// ... and stroke
$graph->Stroke();
?>