Follow


高性能なグラフ生成ライブラリ
PHP5、PHP7、PHP8対応の高機能なグラフ生成ライブラリ
20種類以上の豊富なプロット形式をサポート
JpGraph サンプル
← 一覧に戻るexample17.php
<?php // content="text/plain; charset=utf-8"
require_once ("jpgraph/jpgraph.php");
require_once ("jpgraph/jpgraph_line.php");
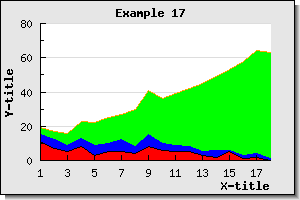
$datay1 = array(11,7,5,8,3,5,5,4,8,6,5,5,3,2,5,1,2,0);
$datay2 = array( 4,5,4,5,6,5,7,4,7,4,4,3,2,4,1,2,2,1);
$datay3 = array(4,5,7,10,13,15,15,22,26,26,30,34,40,43,47,55,60,62);
// Create the graph. These two calls are always required
$graph = new Graph(300,200);
$graph->SetScale("textlin");
$graph->SetShadow();
$graph->img->SetMargin(40,30,20,40);
// Create the linear plots for each category
$dplot[] = new LinePLot($datay1);
$dplot[] = new LinePLot($datay2);
$dplot[] = new LinePLot($datay3);
$dplot[0]->SetFillColor("red");
$dplot[1]->SetFillColor("blue");
$dplot[2]->SetFillColor("green");
// Create the accumulated graph
$accplot = new AccLinePlot($dplot);
// Add the plot to the graph
$graph->Add($accplot);
$graph->xaxis->SetTextTickInterval(2);
$graph->title->Set("Example 17");
$graph->xaxis->title->Set("X-title");
$graph->yaxis->title->Set("Y-title");
$graph->title->SetFont(FF_FONT1,FS_BOLD);
$graph->yaxis->title->SetFont(FF_FONT1,FS_BOLD);
$graph->xaxis->title->SetFont(FF_FONT1,FS_BOLD);
// Display the graph
$graph->Stroke();
?>