Follow


高性能なグラフ生成ライブラリ
PHP5、PHP7、PHP8対応の高機能なグラフ生成ライブラリ
20種類以上の豊富なプロット形式をサポート
JpGraph サンプル
← 一覧に戻るexample24.php
<?php // content="text/plain; charset=utf-8"
require_once ("jpgraph/jpgraph.php");
require_once ("jpgraph/jpgraph_bar.php");
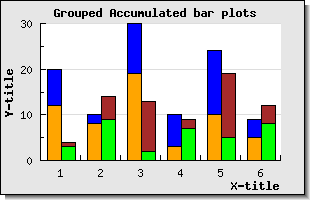
$data1y=array(12,8,19,3,10,5);
$data2y=array(8,2,11,7,14,4);
$data3y=array(3,9,2,7,5,8);
$data4y=array(1,5,11,2,14,4);
// Create the graph. These two calls are always required
$graph = new Graph(310,200);
$graph->SetScale("textlin");
$graph->SetShadow();
$graph->img->SetMargin(40,30,20,40);
$b1plot = new BarPlot($data1y);
$b1plot->SetFillColor("orange");
$b2plot = new BarPlot($data2y);
$b2plot->SetFillColor("blue");
$b3plot = new BarPlot($data3y);
$b3plot->SetFillColor("green");
$b4plot = new BarPlot($data4y);
$b4plot->SetFillColor("brown");
// Create the accumulated bar plots
$ab1plot = new AccBarPlot(array($b1plot,$b2plot));
$ab2plot = new AccBarPlot(array($b3plot,$b4plot));
// Create the grouped bar plot
$gbplot = new GroupBarPlot(array($ab1plot,$ab2plot));
// ...and add it to the graph
$graph->Add($gbplot);
$graph->title->Set("Grouped Accumulated bar plots");
$graph->xaxis->title->Set("X-title");
$graph->yaxis->title->Set("Y-title");
$graph->title->SetFont(FF_FONT1,FS_BOLD);
$graph->yaxis->title->SetFont(FF_FONT1,FS_BOLD);
$graph->xaxis->title->SetFont(FF_FONT1,FS_BOLD);
// Display the graph
$graph->Stroke();
?>