Follow


高性能なグラフ生成ライブラリ
PHP5、PHP7、PHP8対応の高機能なグラフ生成ライブラリ
20種類以上の豊富なプロット形式をサポート
JpGraph サンプル
← 一覧に戻るexample4.php
<?php // content="text/plain; charset=utf-8"
require_once ('jpgraph/jpgraph.php');
require_once ('jpgraph/jpgraph_line.php');
// Some (random) data
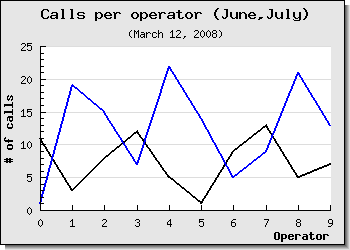
$ydata = array(11, 3, 8, 12, 5, 1, 9, 13, 5, 7);
$ydata2 = array(1, 19, 15, 7, 22, 14, 5, 9, 21, 13 );
// Size of the overall graph
$width=350;
$height=250;
// Create the graph and set a scale.
// These two calls are always required
$graph = new Graph($width,$height);
$graph->SetScale('intlin');
$graph->SetShadow();
// Setup margin and titles
$graph->SetMargin(40,20,20,40);
$graph->title->Set('Calls per operator (June,July)');
$graph->subtitle->Set('(March 12, 2008)');
$graph->xaxis->title->Set('Operator');
$graph->yaxis->title->Set('# of calls');
$graph->yaxis->title->SetFont( FF_FONT1 , FS_BOLD );
$graph->xaxis->title->SetFont( FF_FONT1 , FS_BOLD );
// Create the first data series
$lineplot=new LinePlot($ydata);
$lineplot->SetWeight( 2 ); // Two pixel wide
// Add the plot to the graph
$graph->Add($lineplot);
// Create the second data series
$lineplot2=new LinePlot($ydata2);
$lineplot2->SetWeight( 2 ); // Two pixel wide
// Add the second plot to the graph
$graph->Add($lineplot2);
// Display the graph
$graph->Stroke();
?>