Follow


高性能なグラフ生成ライブラリ
PHP5、PHP7、PHP8対応の高機能なグラフ生成ライブラリ
20種類以上の豊富なプロット形式をサポート
JpGraph サンプル
← 一覧に戻るexample6.php
<?php // content="text/plain; charset=utf-8"
require_once ("jpgraph/jpgraph.php");
require_once ("jpgraph/jpgraph_line.php");
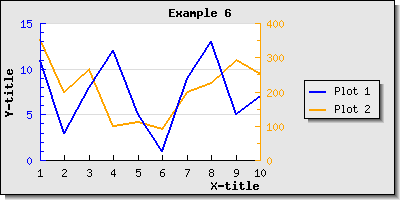
$ydata = array(11,3,8,12,5,1,9,13,5,7);
$y2data = array(354,200,265,99,111,91,198,225,293,251);
// Create the graph and specify the scale for both Y-axis
$graph = new Graph(400,200);
$graph->SetScale('textlin');
$graph->SetY2Scale('lin');
$graph->SetShadow();
// Adjust the margin
$graph->img->SetMargin(40,140,20,40);
// Create the two linear plot
$lineplot=new LinePlot($ydata);
$lineplot2=new LinePlot($y2data);
// Add the plot to the graph
$graph->Add($lineplot);
$graph->AddY2($lineplot2);
$lineplot2->SetColor('orange');
$lineplot2->SetWeight(2);
// Adjust the axis color
$graph->y2axis->SetColor('orange');
$graph->yaxis->SetColor('blue');
$graph->title->Set('Example 6');
$graph->xaxis->title->Set('X-title');
$graph->yaxis->title->Set('Y-title');
$graph->title->SetFont(FF_FONT1,FS_BOLD);
$graph->yaxis->title->SetFont(FF_FONT1,FS_BOLD);
$graph->xaxis->title->SetFont(FF_FONT1,FS_BOLD);
// Set the colors for the plots
$lineplot->SetColor('blue');
$lineplot->SetWeight(2);
$lineplot2->SetColor('orange');
$lineplot2->SetWeight(2);
// Set the legends for the plots
$lineplot->SetLegend('Plot 1');
$lineplot2->SetLegend('Plot 2');
// Adjust the legend position
$graph->legend->Pos(0.05,0.5,'right','center');
// Display the graph
$graph->Stroke();
?>