Follow


高性能なグラフ生成ライブラリ
PHP5、PHP7、PHP8対応の高機能なグラフ生成ライブラリ
20種類以上の豊富なプロット形式をサポート
JpGraph サンプル
← 一覧に戻るexampleex9.php
<?php // content="text/plain; charset=utf-8"
require_once ("jpgraph/jpgraph.php");
require_once ("jpgraph/jpgraph_log.php");
require_once ("jpgraph/jpgraph_line.php");
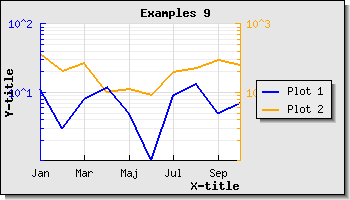
$ydata = array(11,3,8,12,5,1,9,13,5,7);
$y2data = array(354,200,265,99,111,91,198,225,293,251);
$datax = array("Jan","Feb","Mar","Apr","Maj","Jun","Jul","aug","Sep","Oct");
// Create the graph. These two calls are always required
// We also specify a 2 min timeout for the cached image
$graph = new Graph(350,200);
$graph->SetScale("textlog");
$graph->img->SetMargin(40,110,20,40);
$graph->SetY2Scale("log");
$graph->SetShadow();
$graph->ygrid->Show(true,true);
$graph->xgrid->Show(true,false);
// Create the linear plot
$lineplot=new LinePlot($ydata);
$lineplot2=new LinePlot($y2data);
$graph->yaxis->scale->ticks->SupressFirst();
$graph->y2axis->scale->ticks->SupressFirst();
// Add the plot to the graph
$graph->Add($lineplot);
$graph->AddY2($lineplot2);
$lineplot2->SetColor("orange");
$lineplot2->SetWeight(2);
$graph->y2axis->SetColor("orange");
$graph->title->Set("Examples 9");
$graph->xaxis->title->Set("X-title");
$graph->yaxis->title->Set("Y-title");
$graph->title->SetFont(FF_FONT1,FS_BOLD);
$graph->yaxis->title->SetFont(FF_FONT1,FS_BOLD);
$graph->xaxis->title->SetFont(FF_FONT1,FS_BOLD);
$lineplot->SetColor("blue");
$lineplot->SetWeight(2);
$lineplot2->SetColor("orange");
$lineplot2->SetWeight(2);
$graph->yaxis->SetColor("blue");
$lineplot->SetLegend("Plot 1");
$lineplot2->SetLegend("Plot 2");
$graph->legend->Pos(0.05,0.5,"right","center");
$graph->xaxis->SetTickLabels($datax);
$graph->xaxis->SetTextTickInterval(2);
// Display the graph
$graph->Stroke();
?>