Follow


高性能なグラフ生成ライブラリ
PHP5、PHP7、PHP8対応の高機能なグラフ生成ライブラリ
20種類以上の豊富なプロット形式をサポート
JpGraph サンプル
← 一覧に戻るganttcolumnfontsex01.php
<?php // content="text/plain; charset=utf-8"
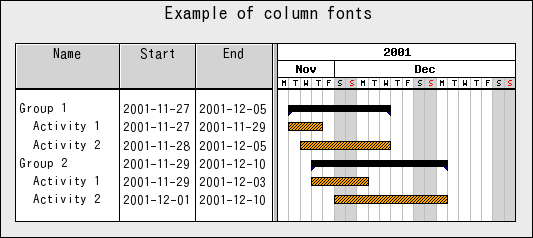
// Gantt column font array example
require_once ("jpgraph/jpgraph.php");
require_once ("jpgraph/jpgraph_gantt.php");
// Setup a basic Gantt graph
$graph = new GanttGraph();
$graph->SetMarginColor('gray:1.7');
$graph->SetColor('white');
// Setup the graph title and title font
$graph->title->Set("Example of column fonts");
$graph->title->SetFont(FF_VERDANA,FS_BOLD,14);
// Show three headers
$graph->ShowHeaders(GANTT_HDAY | GANTT_HMONTH| GANTT_HYEAR);
// Set the column headers and font
$graph->scale->actinfo->SetColTitles( array('Name','Start','End'),array(100));
$graph->scale->actinfo->SetFont(FF_ARIAL,FS_BOLD,11);
// Some "dummy" data to be dsiplayed
$data = array(
array(0,'Group 1', '2001-11-27','2001-12-05'),
array(1,' Activity 1', '2001-11-27','2001-11-29'),
array(2,' Activity 2', '2001-11-28','2001-12-05'),
array(3,'Group 2', '2001-11-29','2001-12-10'),
array(4,' Activity 1', '2001-11-29','2001-12-03'),
array(5,' Activity 2', '2001-12-01','2001-12-10'),
);
// Format and add the Gantt bars to the chart
$n = count($data);
for($i=0; $i < $n; ++$i) {
if( $i === 0 || $i === 3 ) {
// Format the group bars
$bar = new GanttBar($data[$i][0],array($data[$i][1],$data[$i][2],$data[$i][3]),$data[$i][2],$data[$i][3],'',0.35);
// For each group make the name bold but keep the dates as the default font
//$bar->title->SetColumns(array(array(FF_ARIAL,FS_BOLD,11)));
// Add group markers
$bar->leftMark->SetType( MARK_LEFTTRIANGLE );
$bar->leftMark->Show();
$bar->rightMark->SetType( MARK_RIGHTTRIANGLE );
$bar->rightMark->Show();
$bar->SetFillColor('black');
$bar->SetPattern(BAND_SOLID,'black');
}
else {
// Format the activity bars
$bar = new GanttBar($data[$i][0],array($data[$i][1],$data[$i][2],$data[$i][3]),$data[$i][2],$data[$i][3],'',0.45);
$bar->SetPattern(BAND_RDIAG,'black');
$bar->SetFillColor('orange');
}
// Default font
$bar->title->SetFont(FF_ARIAL,FS_NORMAL,10);
$graph->Add($bar);
}
// Send back the graph to the client
$graph->Stroke();
?>