Follow


高性能なグラフ生成ライブラリ
PHP5、PHP7、PHP8対応の高機能なグラフ生成ライブラリ
20種類以上の豊富なプロット形式をサポート
JpGraph サンプル
← 一覧に戻るganttex_slice.php
<?php // content="text/plain; charset=utf-8"
// $Id: ganttex_slice.php,v 1.2 2002/07/11 23:27:28 aditus Exp $
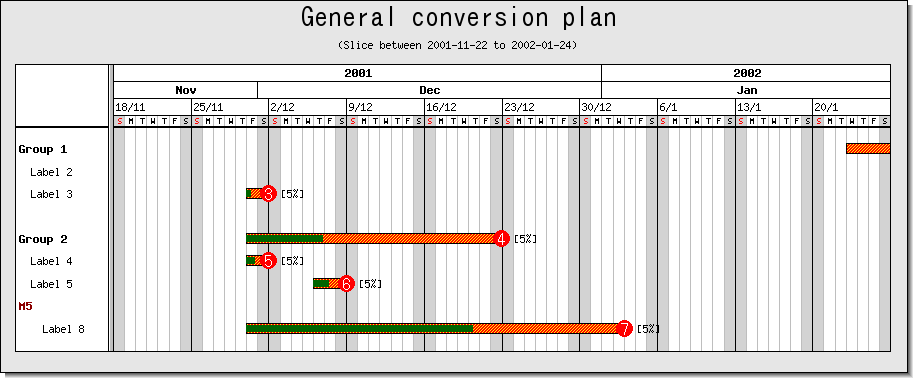
// Gantt example with sunday week start and only shows a partial graph
require_once ("jpgraph/jpgraph.php");
require_once ("jpgraph/jpgraph_gantt.php");
// Setup Gantt graph
$graph = new GanttGraph(0,0,'auto');
$graph->SetShadow();
$graph->SetBox();
// Only show part of the Gantt
$graph->SetDateRange('2001-11-22','2002-1-24');
// Weeks start on Sunday
$graph->scale->SetWeekStart(0);
$graph->title->Set("General conversion plan");
$graph->subtitle->Set("(Slice between 2001-11-22 to 2002-01-24)");
$graph->title->SetFont(FF_ARIAL,FS_BOLD,20);
$graph->ShowHeaders(GANTT_HYEAR | GANTT_HMONTH | GANTT_HDAY | GANTT_HWEEK);
$graph->scale->week->SetStyle(WEEKSTYLE_FIRSTDAY);
$graph->scale->week->SetFont(FF_FONT1);
$data = array(
array(0,"Group 1\tJohan", "2002-1-23","2002-01-28",FF_FONT1,FS_BOLD,8),
array(1," Label 2", "2001-10-26","2001-11-16"),
array(2," Label 3", "2001-11-30","2001-12-01"),
array(4,"Group 2", "2001-11-30","2001-12-22",FF_FONT1,FS_BOLD,8),
array(5," Label 4", "2001-11-30","2001-12-1"),
array(6," Label 5", "2001-12-6","2001-12-8"),
array(8," Label 8", "2001-11-30","2002-01-02")
);
// make up some fictionary activity bars
for($i=0; $i<count($data); ++$i) {
$bar = new GanttBar($data[$i][0],$data[$i][1],$data[$i][2],$data[$i][3],"[5%]",10);
if( count($data[$i])>4 )
$bar->title->SetFont($data[$i][4],$data[$i][5],$data[$i][6]);
$bar->rightMark->Show();
$bar->rightMark->SetType(MARK_FILLEDCIRCLE);
$bar->rightMark->SetWidth(8);
$bar->rightMark->SetColor("red");
$bar->rightMark->SetFillColor("red");
$bar->rightMark->title->Set($i+1);
$bar->rightMark->title->SetFont(FF_ARIAL,FS_BOLD,12);
$bar->rightMark->title->SetColor("white");
$bar->SetPattern(BAND_RDIAG,"yellow");
$bar->SetFillColor("red");
$bar->progress->Set($i/10);
$bar->progress->SetPattern(GANTT_SOLID,"darkgreen");
$graph->Add($bar);
}
// The line will NOT be shown since it is outside the specified slice
$vline = new GanttVLine("2002-02-28");
$vline->title->Set("2002-02-28");
$vline->title->SetFont(FF_FONT1,FS_BOLD,10);
$graph->Add($vline);
// The milestone will NOT be shown since it is outside the specified slice
$ms = new MileStone(7,"M5","2002-01-28","28/1");
$ms->title->SetFont(FF_FONT1,FS_BOLD);
$graph->Add($ms);
$graph->Stroke();
?>