Follow


高性能なグラフ生成ライブラリ
PHP5、PHP7、PHP8対応の高機能なグラフ生成ライブラリ
20種類以上の豊富なプロット形式をサポート
JpGraph サンプル
← 一覧に戻るgantthgridex1.php
<?php // content="text/plain; charset=utf-8"
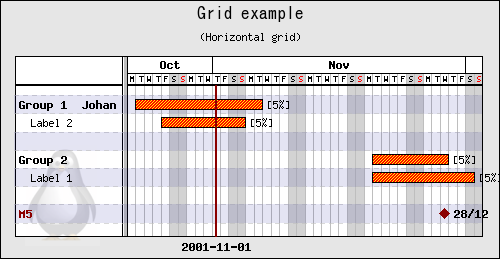
// Gantt horizontal grid example
require_once ("jpgraph/jpgraph.php");
require_once ("jpgraph/jpgraph_gantt.php");
// Some dummy data for some activities
$data = array(
array(0,"Group 1 Johan", "2001-10-23","2001-11-06",FF_FONT1,FS_BOLD,8),
array(1," Label 2", "2001-10-26","2001-11-04"),
array(3,"Group 2", "2001-11-20","2001-11-28",FF_FONT1,FS_BOLD,8),
array(4," Label 1", "2001-11-20","2001-12-1"));
// New Gantt Graph
$graph = new GanttGraph(500);
// Setup a title
$graph->title->Set("Grid example");
$graph->subtitle->Set("(Horizontal grid)");
$graph->title->SetFont(FF_VERDANA,FS_NORMAL,14);
// Specify what headers to show
$graph->ShowHeaders(GANTT_HMONTH|GANTT_HDAY );
$graph->scale->week->SetStyle(WEEKSTYLE_FIRSTDAY);
$graph->scale->week->SetFont(FF_FONT0);
// Setup a horizontal grid
$graph->hgrid->Show();
$graph->hgrid->SetRowFillColor('darkblue@0.9');
for($i=0; $i<count($data); ++$i) {
$bar = new GanttBar($data[$i][0],$data[$i][1],$data[$i][2],$data[$i][3],"[5%]",10);
if( count($data[$i]) > 4 )
$bar->title->SetFont($data[$i][4],$data[$i][5],$data[$i][6]);
$bar->SetPattern(BAND_RDIAG,"yellow");
$bar->SetFillColor("red");
$graph->Add($bar);
}
// Setup a vertical marker line
$vline = new GanttVLine("2001-11-01");
$vline->SetDayOffset(0.5);
$vline->title->Set("2001-11-01");
$vline->title->SetFont(FF_FONT1,FS_BOLD,10);
$graph->Add($vline);
// Setup a milestone
$ms = new MileStone(6,"M5","2001-11-28","28/12");
$ms->title->SetFont(FF_FONT1,FS_BOLD);
$graph->Add($ms);
// And to show that you can also add an icon we add "Tux"
$icon = new IconPlot('penguin.png',0.05,0.95,1,15);
$icon->SetAnchor('left','bottom');
$graph->Add($icon);
// .. and finally send it back to the browser
$graph->Stroke();
?>