Follow


高性能なグラフ生成ライブラリ
PHP5、PHP7、PHP8対応の高機能なグラフ生成ライブラリ
20種類以上の豊富なプロット形式をサポート
JpGraph サンプル
← 一覧に戻るgantthourminex1.php
<?php // content="text/plain; charset=utf-8"
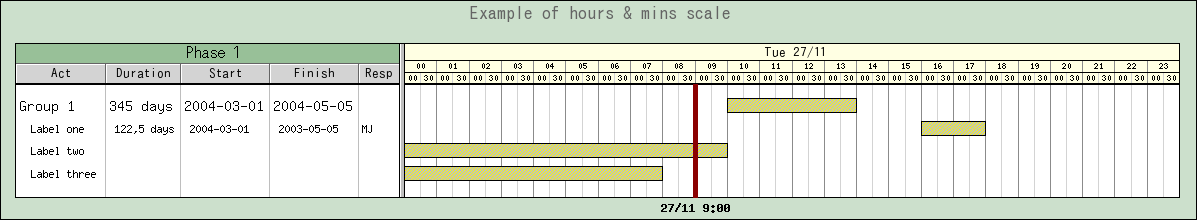
// Gantt hour + minute example
require_once ("jpgraph/jpgraph.php");
require_once ("jpgraph/jpgraph_gantt.php");
// Some sample Gantt data
$data = array(
array(0,array("Group 1","345 days","2004-03-01","2004-05-05"), "2001-11-27 10:00","2001-11-27 14:00",FF_FONT2,FS_NORMAL,0),
array(1,array(" Label one",' 122,5 days',' 2004-03-01',' 2003-05-05','MJ'), "2001-11-27 16:00","2001-11-27 18:00"),
array(2," Label two", "2001-11-27","2001-11-27 10:00"),
array(3," Label three", "2001-11-27","2001-11-27 08:00")
);
// Basic graph parameters
$graph = new GanttGraph();
$graph->SetMarginColor('darkgreen@0.8');
$graph->SetColor('white');
// We want to display day, hour and minute scales
$graph->ShowHeaders(GANTT_HDAY | GANTT_HHOUR | GANTT_HMIN);
// We want to have the following titles in our columns
// describing each activity
$graph->scale->actinfo->SetColTitles(
array('Act','Duration','Start','Finish','Resp'));//,array(100,70,70,70));
// Uncomment the following line if you don't want the 3D look
// in the columns headers
//$graph->scale->actinfo->SetStyle(ACTINFO_2D);
$graph->scale->actinfo->SetFont(FF_ARIAL,FS_NORMAL,10);
//These are the default values for use in the columns
//$graph->scale->actinfo->SetFontColor('black');
//$graph->scale->actinfo->SetBackgroundColor('lightgray');
//$graph->scale->actinfo->vgrid->SetStyle('solid');
$graph->scale->actinfo->vgrid->SetColor('gray');
$graph->scale->actinfo->SetColor('darkgray');
// Setup day format
$graph->scale->day->SetBackgroundColor('lightyellow:1.5');
$graph->scale->day->SetFont(FF_ARIAL);
$graph->scale->day->SetStyle(DAYSTYLE_SHORTDAYDATE1);
// Setup hour format
$graph->scale->hour->SetIntervall(1);
$graph->scale->hour->SetBackgroundColor('lightyellow:1.5');
$graph->scale->hour->SetFont(FF_FONT0);
$graph->scale->hour->SetStyle(HOURSTYLE_H24);
$graph->scale->hour->grid->SetColor('gray:0.8');
// Setup minute format
$graph->scale->minute->SetIntervall(30);
$graph->scale->minute->SetBackgroundColor('lightyellow:1.5');
$graph->scale->minute->SetFont(FF_FONT0);
$graph->scale->minute->SetStyle(MINUTESTYLE_MM);
$graph->scale->minute->grid->SetColor('lightgray');
$graph->scale->tableTitle->Set('Phase 1');
$graph->scale->tableTitle->SetFont(FF_ARIAL,FS_NORMAL,12);
$graph->scale->SetTableTitleBackground('darkgreen@0.6');
$graph->scale->tableTitle->Show(true);
$graph->title->Set("Example of hours & mins scale");
$graph->title->SetColor('darkgray');
$graph->title->SetFont(FF_VERDANA,FS_BOLD,14);
for($i=0; $i<count($data); ++$i) {
$bar = new GanttBar($data[$i][0],$data[$i][1],$data[$i][2],$data[$i][3]);
if( count($data[$i])>4 )
$bar->title->SetFont($data[$i][4],$data[$i][5],$data[$i][6]);
$bar->SetPattern(BAND_RDIAG,"yellow");
$bar->SetFillColor("gray");
$graph->Add($bar);
}
//$vline = new GanttVLine("2001-11-27");//d=1006858800,
$vline = new GanttVLine("2001-11-27 9:00");//d=1006858800,
$vline->SetWeight(5);
$vline->SetDayOffset(0);
$vline->title->Set("27/11 9:00");
$vline->title->SetFont(FF_FONT1,FS_BOLD,10);
$graph->Add($vline);
$graph->Stroke();
?>