Follow


高性能なグラフ生成ライブラリ
PHP5、PHP7、PHP8対応の高機能なグラフ生成ライブラリ
20種類以上の豊富なプロット形式をサポート
JpGraph サンプル
← 一覧に戻るganttmonthyearex3.php
<?php // content="text/plain; charset=utf-8"
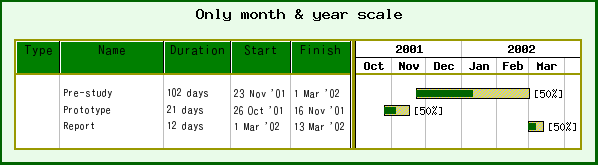
// Gantt example
require_once ("jpgraph/jpgraph.php");
require_once ("jpgraph/jpgraph_gantt.php");
$graph = new GanttGraph();
$graph->title->Set("Only month & year scale");
// Setup some "very" nonstandard colors
$graph->SetMarginColor('lightgreen@0.8');
$graph->SetBox(true,'yellow:0.6',2);
$graph->SetFrame(true,'darkgreen',4);
$graph->scale->divider->SetColor('yellow:0.6');
$graph->scale->dividerh->SetColor('yellow:0.6');
// Explicitely set the date range
// (Autoscaling will of course also work)
$graph->SetDateRange('2001-10-06','2002-4-10');
// Display month and year scale with the gridlines
$graph->ShowHeaders(GANTT_HMONTH | GANTT_HYEAR);
$graph->scale->month->grid->SetColor('gray');
$graph->scale->month->grid->Show(true);
$graph->scale->year->grid->SetColor('gray');
$graph->scale->year->grid->Show(true);
// Setup activity info
// For the titles we also add a minimum width of 100 pixels for the Task name column
$graph->scale->actinfo->SetColTitles(
array('Type','Name','Duration','Start','Finish'),array(40,100));
$graph->scale->actinfo->SetBackgroundColor('green:0.5@0.5');
$graph->scale->actinfo->SetFont(FF_ARIAL,FS_NORMAL,10);
$graph->scale->actinfo->vgrid->SetStyle('solid');
$graph->scale->actinfo->vgrid->SetColor('gray');
// Data for our example activities
$data = array(
array(0,array("","Pre-study","102 days","23 Nov '01","1 Mar '02")
, "2001-11-23","2002-03-1",FF_ARIAL,FS_NORMAL,8),
array(1,array("","Prototype","21 days","26 Oct '01","16 Nov '01"),
"2001-10-26","2001-11-16",FF_ARIAL,FS_NORMAL,8),
array(2,array("","Report","12 days","1 Mar '02","13 Mar '02"),
"2002-03-01","2002-03-13",FF_ARIAL,FS_NORMAL,8)
);
// Create the bars and add them to the gantt chart
for($i=0; $i<count($data); ++$i) {
$bar = new GanttBar($data[$i][0],$data[$i][1],$data[$i][2],$data[$i][3],"[50%]",10);
if( count($data[$i])>4 )
$bar->title->SetFont($data[$i][4],$data[$i][5],$data[$i][6]);
$bar->SetPattern(BAND_RDIAG,"yellow");
$bar->SetFillColor("gray");
$bar->progress->Set(0.5);
$bar->progress->SetPattern(GANTT_SOLID,"darkgreen");
$graph->Add($bar);
}
// Output the chart
$graph->Stroke();
?>