Follow


高性能なグラフ生成ライブラリ
PHP5、PHP7、PHP8対応の高機能なグラフ生成ライブラリ
20種類以上の豊富なプロット形式をサポート
JpGraph サンプル
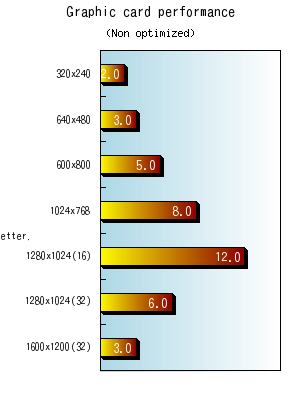
← 一覧に戻るhorizbarex6.php
<?php // content="text/plain; charset=utf-8"
require_once ("jpgraph/jpgraph.php");
require_once ("jpgraph/jpgraph_bar.php");

$datay=array(2,3,5,8,12,6,3);
$datax=array("320x240","640x480","600x800","1024x768","1280x1024(16)","1280x1024(32)",
	     "1600x1200(32)");

// Size of graph
$width=300;
$height=400;

// Set the basic parameters of the graph
$graph = new Graph($width,$height,'auto');
$graph->SetScale("textlin");

// No frame around the image
$graph->SetFrame(false);

// Rotate graph 90 degrees and set margin
$graph->Set90AndMargin(100,20,50,30);

// Set white margin color
$graph->SetMarginColor('white');

// Use a box around the plot area
$graph->SetBox();

// Use a gradient to fill the plot area
$graph->SetBackgroundGradient('white','lightblue',GRAD_HOR,BGRAD_PLOT);

// Setup title
$graph->title->Set("Graphic card performance");
$graph->title->SetFont(FF_VERDANA,FS_BOLD,11);
$graph->subtitle->Set("(Non optimized)");

// Setup X-axis
$graph->xaxis->SetTickLabels($datax);
$graph->xaxis->SetFont(FF_VERDANA,FS_NORMAL,8);

// Some extra margin looks nicer
$graph->xaxis->SetLabelMargin(10);

// Label align for X-axis
$graph->xaxis->SetLabelAlign('right','center');

// Add some grace to y-axis so the bars doesn't go
// all the way to the end of the plot area
$graph->yaxis->scale->SetGrace(20);

// We don't want to display Y-axis
$graph->yaxis->Hide();

// Now create a bar pot
$bplot = new BarPlot($datay);
$bplot->SetShadow();

//You can change the width of the bars if you like
//$bplot->SetWidth(0.5);

// Set gradient fill for bars
$bplot->SetFillGradient('darkred','yellow',GRAD_HOR);

// We want to display the value of each bar at the top
$bplot->value->Show();
$bplot->value->SetFont(FF_ARIAL,FS_BOLD,10);
//$bplot->value->SetAlign('left','center');
$bplot->value->SetColor("white");
$bplot->value->SetFormat('%.1f');
$bplot->SetValuePos('max');

// Add the bar to the graph
$graph->Add($bplot);

// Add some explanation text
$txt = new Text('Note: Higher value is better.');
$txt->SetPos(190,399,'center','bottom');
$txt->SetFont(FF_ARIAL,FS_NORMAL,8);
$graph->Add($txt);

// .. and stroke the graph
$graph->Stroke();
?>