Follow


高性能なグラフ生成ライブラリ
PHP5、PHP7、PHP8対応の高機能なグラフ生成ライブラリ
20種類以上の豊富なプロット形式をサポート
JpGraph サンプル
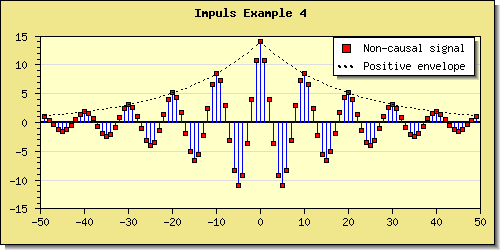
← 一覧に戻るimpulsex4.php
<?php // content="text/plain; charset=utf-8"
require_once ("jpgraph/jpgraph.php");
require_once ("jpgraph/jpgraph_scatter.php");
require_once ("jpgraph/jpgraph_line.php");
require_once ("jpgraph/jpgraph_plotline.php");

$numpoints=50;
$k=0.05;

// Create some data points
for($i=-$numpoints+1; $i<0; ++$i) {
	$datay[$i+$numpoints-1]=exp($k*$i)*cos(2*M_PI/10*$i)*14;
	$datayenv[$i+$numpoints-1]=exp($k*$i)*14;
	$datax[$i+$numpoints-1]=$i;
}

for($i=0; $i<$numpoints; ++$i) {
	$datay[$i+$numpoints-1]=exp(-$k*$i)*cos(2*M_PI/10*$i)*14;
	$datayenv[$i+$numpoints-1]=exp(-$k*$i)*14;
	$datax[$i+$numpoints-1]=$i;
}

// Setup the basic parameters for the graph
$graph = new Graph(500,250);
$graph->SetScale("intlin");

$graph->SetShadow();
$graph->SetBox();
$graph->title->Set("Impuls Example 4");
$graph->title->SetFont(FF_FONT1,FS_BOLD);

// Set some other color then the boring default
$graph->SetColor("lightyellow");
$graph->SetMarginColor("khaki");

// Set legend box specification
$graph->legend->SetFillColor("white");
$graph->legend->SetLineWeight(2);

// Set X-axis at the minimum value of Y-axis (default will be at 0)
$graph->xaxis->SetPos("min");	// "min" will position the x-axis at the minimum value of the Y-axis

// Extend the margin for the labels on the Y-axis and reverse the direction
// of the ticks on the Y-axis
$graph->yaxis->SetLabelMargin(12);
$graph->xaxis->SetLabelMargin(6);
$graph->yaxis->SetTickSide(SIDE_LEFT);
$graph->xaxis->SetTickSide(SIDE_DOWN);

// Add mark graph with static lines
$line = new PlotLine(HORIZONTAL,0,"black",2);
$graph->AddLine($line);

// Create a new impuls type scatter plot
$sp1 = new ScatterPlot($datay,$datax);
$sp1->mark->SetType(MARK_SQUARE);
$sp1->mark->SetFillColor("red");
$sp1->mark->SetWidth(3);

$sp1->SetImpuls();
$sp1->SetColor("blue");
$sp1->SetWeight(1);
$sp1->SetLegend("Non-causal signal");

$graph->Add($sp1);

// Create the envelope plot
$ep1 = new LinePlot($datayenv,$datax);
$ep1->SetStyle("dotted");
$ep1->SetLegend("Positive envelope");

$graph->Add($ep1);

$graph->Stroke();

?>