Follow


高性能なグラフ生成ライブラリ
PHP5、PHP7、PHP8対応の高機能なグラフ生成ライブラリ
20種類以上の豊富なプロット形式をサポート
JpGraph サンプル
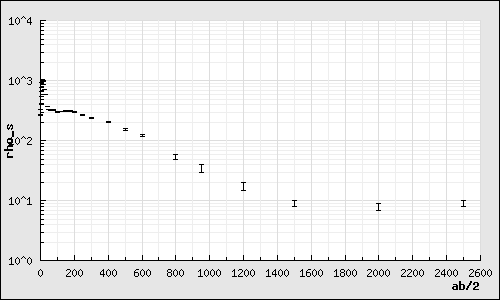
← 一覧に戻るlinlogex1.php
<?php // content="text/plain; charset=utf-8"

require_once ("jpgraph/jpgraph.php");
require_once ("jpgraph/jpgraph_log.php");
require_once ("jpgraph/jpgraph_error.php");

$xdata = array( 2.0,  2.5,  3.0,  4.0,  5.0,  6.0,  8.0, 10.0,
               12.0, 15.0, 20.0, 25.0, 30.0, 40.0, 50.0, 60.0,
               75.0, 100., 125., 150., 175., 200., 250., 300.,
               400., 500., 600., 800., 950.,
              1200., 1500., 2000., 2500.);
$ydata = array(270.,  280., // 2 m
               330.,  340., // 2.5
               410.,  420., // 3
               550.,  560., // 4
               670.,  680., // 5
               770.,  780., // 6
               930.,  940., // 8
              1010., 1020., // 10
              1040., 1050., // 12
               980.,  990., // 15
               860.,  870., // 20
               720.,  730., // 25
               590.,  600., // 30
               370.,  380., // 40
               330.,  340., // 50
               320.,  330., // 60
               320.,  330., // 75
               300.,  310., // 100
               305.,  315., // 125
               310.,  320., // 150
               315.,  325., // 175
               300.,  310., // 200
               270.,  280., // 250
               240.,  250., // 300
               200.,  210., // 400
               150.,  160., // 500
               120.,  130., // 600
                50.,   60., // 800
                30.,   40., // 950
                15.,   20., // 1200
                 8.,   10., // 1500
                 7.,    9., // 2000
                 8.,   10.  // 2500 m
               );

$graph = new Graph(500,300);
$graph->SetScale("linlog");
$graph->img->SetMargin(40,20,20,40);
$graph->title->SetFont(FF_FONT1,FS_BOLD);
$graph->xaxis->title->Set("ab/2");
$graph->yaxis->title->Set("rho_s");
$graph->xaxis->title->SetFont(FF_FONT1,FS_BOLD);
$graph->yaxis->title->SetFont(FF_FONT1,FS_BOLD);
$graph->ygrid->Show(true,true);
$graph->xgrid->Show(true,true);

$errorplot=new ErrorPlot($ydata, $xdata);

$graph->Add($errorplot);

$graph->Stroke();

?>