Follow


高性能なグラフ生成ライブラリ
PHP5、PHP7、PHP8対応の高機能なグラフ生成ライブラリ
20種類以上の豊富なプロット形式をサポート
JpGraph サンプル
← 一覧に戻るmanualtickex1a.php
<?php // content="text/plain; charset=utf-8"
//
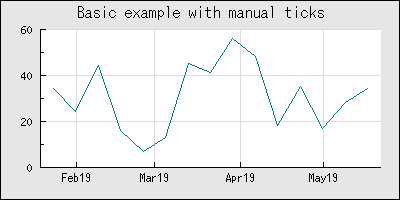
// Basic example on how to use custom tickmark feature to have a label
// at the start of each month.
//
require_once ("jpgraph/jpgraph.php");
require_once ("jpgraph/jpgraph_line.php");
require_once ("jpgraph/jpgraph_utils.inc.php");
//
// Create some random data for the plot. We use the current time for the
// first X-position
//
$datay = array();
$datax = array();
$ts = time();
$n=15; // Number of data points
for($i=0; $i < $n; ++$i ) {
$datax[$i] = $ts+$i*700000;
$datay[$i] = rand(5,60);
}
// Now get labels at the start of each month
$dateUtils = new DateScaleUtils();
list($tickPositions,$minTickPositions) = $dateUtils->GetTicks($datax);
// We add some grace to the end of the X-axis scale so that the first and last
// data point isn't exactly at the very end or beginning of the scale
$grace = 400000;
$xmin = $datax[0]-$grace;
$xmax = $datax[$n-1]+$grace;
//
// The code to setup a very basic graph
//
$graph = new Graph(400,200);
//
// We use an integer scale on the X-axis since the positions on the X axis
// are assumed to be UNI timestamps
$graph->SetScale('intlin',0,0,$xmin,$xmax);
$graph->title->Set('Basic example with manual ticks');
$graph->title->SetFont(FF_ARIAL,FS_NORMAL,12);
//
// Make sure that the X-axis is always at the bottom of the scale
// (By default the X-axis is alwys positioned at Y=0 so if the scale
// doesn't happen to include 0 the axis will not be shown)
$graph->xaxis->SetPos('min');
// Now set the tic positions
$graph->xaxis->SetTickPositions($tickPositions,$minTickPositions);
// The labels should be formatted at dates with "Year-month"
$graph->xaxis->SetLabelFormatString('My',true);
// Use Ariel font
$graph->xaxis->SetFont(FF_ARIAL,FS_NORMAL,9);
// Add a X-grid
$graph->xgrid->Show();
// Create the plot line
$p1 = new LinePlot($datay,$datax);
$p1->SetColor('teal');
$graph->Add($p1);
// Output graph
$graph->Stroke();
?>