Follow


高性能なグラフ生成ライブラリ
PHP5、PHP7、PHP8対応の高機能なグラフ生成ライブラリ
20種類以上の豊富なプロット形式をサポート
JpGraph サンプル
← 一覧に戻るmanualtickex4.php
<?php // content="text/plain; charset=utf-8"
//
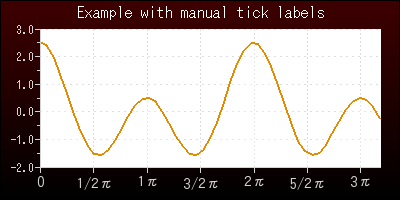
// Basic example on how to use custom tickmark feature to have a label
// at the start of each month.
//
require_once ('jpgraph/jpgraph.php');
require_once ('jpgraph/jpgraph_line.php');
require_once ('jpgraph/jpgraph_utils.inc.php');
//
// Create some random data for the plot. We use the current time for the
// first X-position
//
$f = new FuncGenerator('cos($x)+1.5*cos(2*$x)');
list($datax,$datay) = $f->E(0,10);
// Now get labels at 1/2 PI intervall
$tickPositions = array();
$tickLabels = array();
$tickPositions[0] = 0;
$tickLabels[0] = '0';
for($i=1; $i/2*M_PI < 11 ; ++$i ) {
$tickPositions[$i] = $i/2*M_PI;
if( $i % 2 )
$tickLabels[$i] = $i.'/2'.SymChar::Get('pi');
else
$tickLabels[$i] = ($i/2).SymChar::Get('pi');
}
$n = count($datax);
$xmin = $datax[0];
$xmax = $datax[$n-1];
//
// The code to setup a very basic graph
//
$graph = new Graph(400,200);
// We use an integer scale on the X-axis since the positions on the X axis
// are assumed to be UNI timestamps
$graph->SetScale('linlin',0,0,$xmin,$xmax);
$graph->title->Set('Example with manual tick labels');
$graph->title->SetFont(FF_ARIAL,FS_BOLD,12);
$graph->title->SetColor('white');
// Setup a abackground gradient
$graph->SetBackgroundGradient('darkred:0.7', 'black', 2, BGRAD_MARGIN);
//$graph->SetPlotGradient('black','darkred:0.8', 2);
// Make sure that the X-axis is always at the bottom of the scale
// (By default the X-axis is alwys positioned at Y=0 so if the scale
// doesn't happen to include 0 the axis will not be shown)
$graph->xaxis->SetPos('min');
// Now set the tic positions
$graph->xaxis->SetMajTickPositions($tickPositions,$tickLabels);
// Use Times font
$graph->xaxis->SetFont(FF_TIMES,FS_NORMAL,11);
$graph->yaxis->SetFont(FF_TIMES,FS_NORMAL,9);
// Set colors for axis
$graph->xaxis->SetColor('lightgray');
$graph->yaxis->SetColor('lightgray');
// Add a X-grid
$graph->xgrid->Show();
// Show ticks outwards
$graph->xaxis->SetTickSide(SIDE_DOWN);
$graph->xaxis->SetLabelMargin(8);
$graph->yaxis->SetTickSide(SIDE_LEFT);
// Setup a filled y-grid
//$graph->ygrid->SetFill(true,'darkgray:1.55@0.7','darkgray:1.6@0.7');
$graph->ygrid->SetLineStyle('dotted');
$graph->xgrid->SetLineStyle('dashed');
// Create the plot line
$p1 = new LinePlot($datay,$datax);
$p1->SetWeight(2);
$p1->SetColor('orange:0.9');
$p1->SetFillColor('white@0.7');
$p1->SetFillFromYMin();
$graph->Add($p1);
// Output graph
$graph->Stroke();
?>