Follow


高性能なグラフ生成ライブラリ
PHP5、PHP7、PHP8対応の高機能なグラフ生成ライブラリ
20種類以上の豊富なプロット形式をサポート
JpGraph サンプル
← 一覧に戻るmarkflagex1.php
<?php // content="text/plain; charset=utf-8"
require_once ("jpgraph/jpgraph.php");
require_once ("jpgraph/jpgraph_line.php");
require_once ("jpgraph/jpgraph_scatter.php");
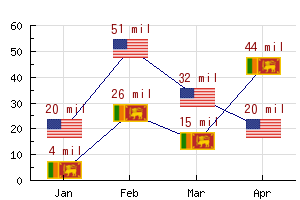
$datay = array(
array(4,26,15,44),
array(20,51,32,20));
// Setup the graph
$graph = new Graph(300,200);
$graph->SetMarginColor('white');
$graph->SetScale("textlin");
$graph->SetFrame(false);
$graph->SetMargin(30,5,25,20);
// Enable X-grid as well
$graph->xgrid->Show();
// Use months as X-labels
$graph->xaxis->SetTickLabels($gDateLocale->GetShortMonth());
//------------------------
// Create the plots
//------------------------
$p1 = new LinePlot($datay[0]);
$p1->SetColor("navy");
// Use a flag
$p1->mark->SetType(MARK_FLAG1,197);
// Displayes value on top of marker image
$p1->value->SetFormat('%d mil');
$p1->value->Show();
$p1->value->SetColor('darkred');
$p1->value->SetFont(FF_ARIAL,FS_BOLD,10);
// Increase the margin so that the value is printed avove tje
// img marker
$p1->value->SetMargin(14);
// Incent the X-scale so the first and last point doesn't
// fall on the edges
$p1->SetCenter();
$graph->Add($p1);
//------------
// 2:nd plot
//------------
$p2 = new LinePlot($datay[1]);
$p2->SetColor("navy");
// Use a flag
$p2->mark->SetType(MARK_FLAG1,'united states');
// Displayes value on top of marker image
$p2->value->SetFormat('%d mil');
$p2->value->Show();
$p2->value->SetColor('darkred');
$p2->value->SetFont(FF_ARIAL,FS_BOLD,10);
// Increase the margin so that the value is printed avove tje
// img marker
$p2->value->SetMargin(14);
// Incent the X-scale so the first and last point doesn't
// fall on the edges
$p2->SetCenter();
$graph->Add($p2);
$graph->Stroke();
?>