Follow


高性能なグラフ生成ライブラリ
PHP5、PHP7、PHP8対応の高機能なグラフ生成ライブラリ
20種類以上の豊富なプロット形式をサポート
JpGraph サンプル
← 一覧に戻るprepaccdata_example.php
<?php // content="text/plain; charset=utf-8"
include('../jpgraph.php');
include("../jpgraph_line.php");
include("../jpgraph_date.php");
//Create some test data
$xdata = array();
$ydata = array();
// Timestamps - 2h (=7200s) apart starting
$sampling = 7200;
$n = 50; // data points
for($i=0; $i < $n; ++$i ) {
$xdata[$i] = time() + $i * $sampling;
$ydata[0][$i] = rand(12,15);
$ydata[1][$i] = rand(100,155);
$ydata[2][$i] = rand(20,30);
}
function formatDate(&$aVal) {
$aVal = date('Y-m-d H:i',$aVal);
}
// Apply this format to all time values in the data to prepare it to be display
array_walk($xdata,'formatDate');
// Create the graph.
$graph = new Graph(600, 350);
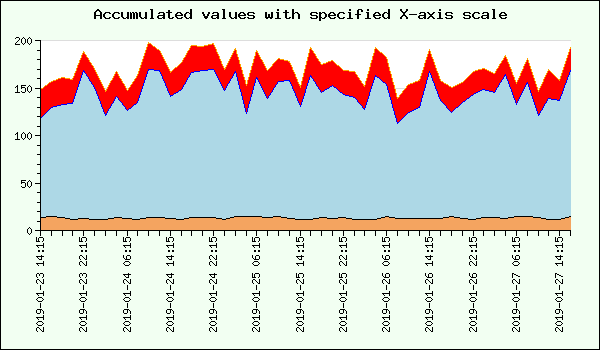
$graph->title->Set('Accumulated values with specified X-axis scale');
$graph->SetScale('textlin');
// Setup margin color
$graph->SetMarginColor('green@0.95');
// Adjust the margin to make room for the X-labels
$graph->SetMargin(40,30,40,120);
// Turn the tick marks out from the plot area
$graph->xaxis->SetTickSide(SIDE_BOTTOM);
$graph->yaxis->SetTickSide(SIDE_LEFT);
$p0 =new LinePlot($ydata[0]);
$p0->SetFillColor('sandybrown');
$p1 =new LinePlot($ydata[1]);
$p1->SetFillColor('lightblue');
$p2 =new LinePlot($ydata[2]);
$p2->SetFillColor('red');
$ap = new AccLinePlot(array($p0,$p1,$p2));
$graph->xaxis->SetTickLabels($xdata);
$graph->xaxis->SetTextLabelInterval(4);
// Add the plot to the graph
$graph->Add($ap);
// Set the angle for the labels to 90 degrees
$graph->xaxis->SetLabelAngle(90);
// Display the graph
$graph->Stroke();
?>