Follow


高性能なグラフ生成ライブラリ
PHP5、PHP7、PHP8対応の高機能なグラフ生成ライブラリ
20種類以上の豊富なプロット形式をサポート
JpGraph サンプル
← 一覧に戻るradarex6.1.php
<?php // content="text/plain; charset=utf-8"
require_once ("jpgraph/jpgraph.php");
require_once ("jpgraph/jpgraph_radar.php");
// Some data to plot
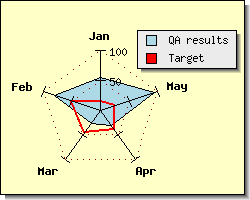
$data = array(55,80,26,31,95);
$data2 = array(15,50,46,39,25);
// Create the graph and the plot
$graph = new RadarGraph(250,200);
// Add a drop shadow to the graph
$graph->SetShadow();
// Create the titles for the axis
$titles = $gDateLocale->GetShortMonth();
$graph->SetTitles($titles);
$graph->SetColor('lightyellow');
// ADjust the position to make more room
// for the legend
$graph->SetCenter(0.4,0.55);
$graph->SetSize(0.6);
// Add grid lines
$graph->grid->Show();
$graph->grid->SetColor('darkred');
$graph->grid->SetLineStyle('dotted');
$plot = new RadarPlot($data);
$plot->SetFillColor('lightblue');
$plot->SetLegend("QA results");
$plot2 = new RadarPlot($data2);
$plot2->SetLegend("Target");
$plot2->SetColor('red');
$plot2->SetFill(false);
$plot2->SetLineWeight(2);
// Add the plot and display the graph
$graph->Add($plot);
$graph->Add($plot2);
$graph->Stroke();
?>