Follow


高性能なグラフ生成ライブラリ
PHP5、PHP7、PHP8対応の高機能なグラフ生成ライブラリ
20種類以上の豊富なプロット形式をサポート
JpGraph サンプル
← 一覧に戻るradarex7.php
<?php // content="text/plain; charset=utf-8"
require_once ("jpgraph/jpgraph.php");
require_once ("jpgraph/jpgraph_radar.php");
// Create the basic rtadar graph
$graph = new RadarGraph(300,200);
// Set background color and shadow
$graph->SetColor("white");
$graph->SetShadow();
// Position the graph
$graph->SetCenter(0.4,0.55);
// Setup the axis formatting
$graph->axis->SetFont(FF_FONT1,FS_BOLD);
$graph->axis->SetWeight(2);
// Setup the grid lines
$graph->grid->SetLineStyle("longdashed");
$graph->grid->SetColor("navy");
$graph->grid->Show();
$graph->HideTickMarks();
// Setup graph titles
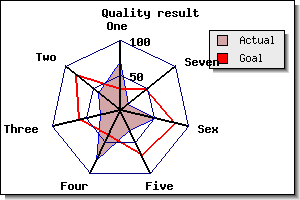
$graph->title->Set("Quality result");
$graph->title->SetFont(FF_FONT1,FS_BOLD);
$graph->SetTitles(array("One","Two","Three","Four","Five","Sex","Seven","Eight","Nine","Ten"));
// Create the first radar plot
$plot = new RadarPlot(array(30,80,60,40,71,81,47));
$plot->SetLegend("Goal");
$plot->SetColor("red","lightred");
$plot->SetFill(false);
$plot->SetLineWeight(2);
// Create the second radar plot
$plot2 = new RadarPlot(array(70,40,30,80,31,51,14));
$plot2->SetLegend("Actual");
$plot2->SetColor("blue","lightred");
// Add the plots to the graph
$graph->Add($plot2);
$graph->Add($plot);
// And output the graph
$graph->Stroke();
?>