Follow


高性能なグラフ生成ライブラリ
PHP5、PHP7、PHP8対応の高機能なグラフ生成ライブラリ
20種類以上の豊富なプロット形式をサポート
JpGraph サンプル
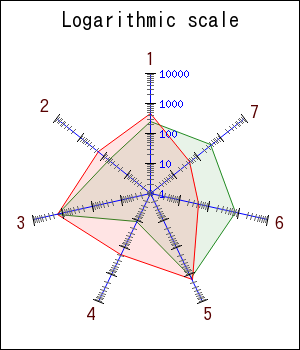
← 一覧に戻るradarlogex1-aa.php
<?php // content="text/plain; charset=utf-8"
require_once ('jpgraph/jpgraph.php');
require_once ('jpgraph/jpgraph_log.php');
require_once ('jpgraph/jpgraph_radar.php');

// Some data to plot
$data = array(242,58,1500,12,1397,810,373);
$data2 = array(447,176,1472,191,1616,42,46);

// Create the graph
$graph = new RadarGraph(300,350);

// Use logarithmic scale (If you don't use any SetScale()
// the radar graph will default to linear scale
$graph->SetScale('log');

$graph->title->SetFont(FF_ARIAL,FS_BOLD,16);
$graph->title->Set('Logarithmic scale');
$graph->title->SetMargin(10);

// Make the radar graph fill out it's bounding box
$graph->SetPlotSize(0.8);
$graph->SetCenter(0.5,0.55);

// Note: Enabling this results in a very noticable slow
// down of the image generation! And more load on your
// server.
$graph->img->SetAntiAliasing();

// Uncomment the following line if you want to supress
// minor tick marks
//$graph->yscale->ticks->SupressMinorTickMarks();

// We want the major tick marks to be black and minor
// slightly less noticable
$graph->yscale->ticks->SetMarkColor('black','darkgray');

// Set the axis title font
$graph->axis->title->SetFont(FF_ARIAL,FS_BOLD,14);
$graph->axis->title->SetColor('darkred:0.8');

// Use blue axis
$graph->axis->SetColor('blue');

$plot = new RadarPlot($data);
$plot->SetLineWeight(1);
$plot->SetColor('forestgreen');
$plot->SetFillColor('forestgreen@0.9');

$plot2 = new RadarPlot($data2);
$plot2->SetLineWeight(2);
$plot2->SetColor('red');
$plot2->SetFillColor('red@0.9');

// Add the plot and display the graph
$graph->Add($plot);
$graph->Add($plot2);
$graph->Stroke();
?>