Follow


高性能なグラフ生成ライブラリ
PHP5、PHP7、PHP8対応の高機能なグラフ生成ライブラリ
20種類以上の豊富なプロット形式をサポート
JpGraph サンプル
← 一覧に戻るstaticbandbarex6.php
<?php // content="text/plain; charset=utf-8"
require_once ("jpgraph/jpgraph.php");
require_once ("jpgraph/jpgraph_bar.php");
require_once ("jpgraph/jpgraph_plotline.php");
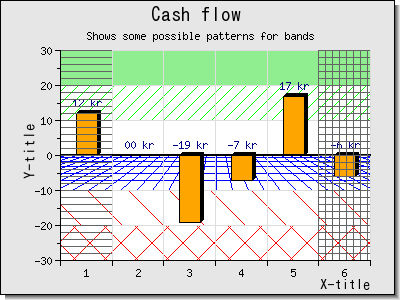
$datay=array(12,0,-19,-7,17,-6);
// Create the graph.
$graph = new Graph(400,300);
$graph->img->SetMargin(60,30,50,40);
$graph->SetScale("textlin");
$graph->SetShadow();
$graph->title->SetFont(FF_ARIAL,FS_BOLD,15);
$graph->title->Set("Cash flow ");
$graph->subtitle->Set("Shows some possible patterns for bands");
// Show both X and Y grid
$graph->xgrid->Show(true,false);
// Add 10% grace ("space") at top and botton of Y-scale.
$graph->yscale->SetGrace(10,10);
// Turn the tick mark out from the plot area
$graph->xaxis->SetTickSide(SIDE_DOWN);
$graph->yaxis->SetTickSide(SIDE_LEFT);
// Create a bar pot
$bplot = new BarPlot($datay);
$bplot->SetFillColor("orange");
$bplot->SetShadow();
// Show the actual value for each bar on top/bottom
$bplot->value->Show(true);
$bplot->value->SetFormat("%02d kr");
// Position the X-axis at the bottom of the plotare
$graph->xaxis->SetPos("min");
// .. and add the plot to the graph
$graph->Add($bplot);
// Add upper and lower band and use no frames
$band[0]=new PlotBand(HORIZONTAL,BAND_RDIAG,10,20,"green");
$band[0]->ShowFrame(false);
$band[1]=new PlotBand(HORIZONTAL,BAND_LDIAG,-20,-10,"red");
$band[1]->ShowFrame(false);
$band[1]->SetDensity(20);
$band[2]=new PlotBand(HORIZONTAL,BAND_DIAGCROSS,"min",-20,"red");
$band[2]->ShowFrame(false);
$band[2]->SetDensity(40);
$band[3]=new PlotBand(VERTICAL,BAND_HLINE,0,1,"darkgray");
$band[3]->ShowFrame(false);
$band[3]->SetOrder(DEPTH_FRONT);
$band[4]=new PlotBand(VERTICAL,BAND_HVCROSS,5,"max","darkgray");
$band[4]->ShowFrame(false);
$band[4]->SetOrder(DEPTH_FRONT);
$band[5]=new PlotBand(HORIZONTAL,BAND_SOLID,20,"max","lightgreen");
$band[6]=new PlotBand(HORIZONTAL,BAND_3DPLANE,-10,0,"blue");
$band[6]->SetDensity(70);
$graph->Add($band);
$graph->AddLine(new PlotLine(HORIZONTAL,0,"black",2));
//$graph->title->Set("Test of bar gradient fill");
$graph->xaxis->title->Set("X-title");
$graph->yaxis->title->Set("Y-title");
$graph->yaxis->title->SetFont(FF_ARIAL,FS_BOLD,11);
$graph->xaxis->title->SetFont(FF_ARIAL,FS_BOLD,11);
$graph->Stroke();
?>