Follow


高性能なグラフ生成ライブラリ
PHP5、PHP7、PHP8対応の高機能なグラフ生成ライブラリ
20種類以上の豊富なプロット形式をサポート
JpGraph サンプル
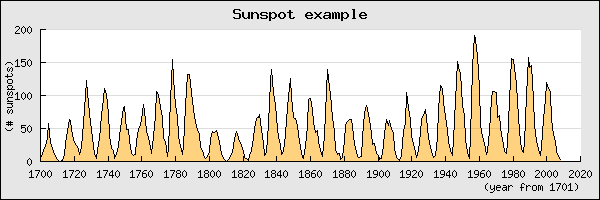
← 一覧に戻るsunspotsex5.php
<?php // content="text/plain; charset=utf-8"
require_once ("jpgraph/jpgraph.php");
require_once ("jpgraph/jpgraph_line.php");
require_once ("jpgraph/jpgraph_bar.php");

function readsunspotdata($aFile, &$aYears, &$aSunspots) {
    $lines = @file($aFile,FILE_IGNORE_NEW_LINES|FILE_SKIP_EMPTY_LINES);
    if( $lines === false ) {
        throw new JpGraphException('Can not read sunspot data file.');
    }
    foreach( $lines as $line => $datarow ) {
        $split = preg_split('/[\s]+/',$datarow);
        $aYears[] = substr(trim($split[0]),0,4);
        $aSunspots[] = trim($split[1]);
    }
}

$year = array();
$ydata = array();
readsunspotdata('yearssn.txt',$year,$ydata);

function year_callback($aLabel) {
    return 1700+(int)$aLabel;
}

 // Width and height of the graph
$width = 600; $height = 200;

// Create a graph instance
$graph = new Graph($width,$height);

// Specify what scale we want to use,
// int = integer scale for the X-axis
// int = integer scale for the Y-axis
$graph->SetScale('intint');

// Setup a title for the graph
$graph->title->Set('Sunspot example');

// Setup titles and X-axis labels
$graph->xaxis->title->Set('(year from 1701)');
$graph->xaxis->SetLabelFormatCallback('year_callback');

// Setup Y-axis title
$graph->yaxis->title->Set('(# sunspots)');

// Create the linear plot
$lineplot=new LinePlot($ydata);
$lineplot->SetFillColor('orange@0.5');

// Add the plot to the graph
$graph->Add($lineplot);

// Display the graph
$graph->Stroke();

?>