高性能なグラフ生成ライブラリ
PHP5、PHP7、PHP8対応の高機能なグラフ生成ライブラリ
20種類以上の豊富なプロット形式をサポート
JpGraph サンプル
← 一覧に戻るtabtitleex1.php

<?php // content="text/plain; charset=utf-8"
require_once ("jpgraph/jpgraph.php");
require_once ("jpgraph/jpgraph_line.php");

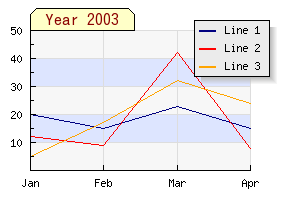
$datay1 = array(20,15,23,15);
$datay2 = array(12,9,42,8);
$datay3 = array(5,17,32,24);

// Setup the graph
$graph = new Graph(300,200);
$graph->SetMarginColor('white');
$graph->SetScale("textlin");
$graph->SetFrame(false);
$graph->SetMargin(30,50,30,30);

$graph->tabtitle->Set(' Year 2003 ' );
$graph->tabtitle->SetFont(FF_ARIAL,FS_BOLD,13);


$graph->yaxis->HideZeroLabel();
$graph->ygrid->SetFill(true,'#EFEFEF@0.5','#BBCCFF@0.5');
$graph->xgrid->Show();

$graph->xaxis->SetTickLabels($gDateLocale->GetShortMonth());

// Create the first line
$p1 = new LinePlot($datay1);
$p1->SetColor("navy");
$p1->SetLegend('Line 1');
$graph->Add($p1);

// Create the second line
$p2 = new LinePlot($datay2);
$p2->SetColor("red");
$p2->SetLegend('Line 2');
$graph->Add($p2);

// Create the third line
$p3 = new LinePlot($datay3);
$p3->SetColor("orange");
$p3->SetLegend('Line 3');
$graph->Add($p3);

$graph->legend->SetShadow('gray@0.4',5);
$graph->legend->SetPos(0.1,0.1,'right','top');
// Output line
$graph->Stroke();

?>
