Follow


高性能なグラフ生成ライブラリ
PHP5、PHP7、PHP8対応の高機能なグラフ生成ライブラリ
20種類以上の豊富なプロット形式をサポート
JpGraph サンプル
← 一覧に戻るtimestampex01.php
<?php // content="text/plain; charset=utf-8"
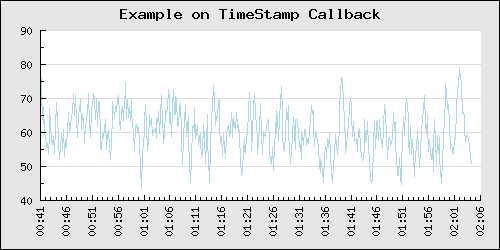
// Example on how to treat and format timestamp as human readable labels
require_once("jpgraph/jpgraph.php");
require_once("jpgraph/jpgraph_line.php");
// Number of "fake" data points
DEFINE('NDATAPOINTS',500);
// Assume data points are sample every 10th second
DEFINE('SAMPLERATE',10);
// Callback formatting function for the X-scale to convert timestamps
// to hour and minutes.
function TimeCallback($aVal) {
return Date('H:i', $aVal);
}
// Get start time
$start = time();
// Set the start time to be on the closest minute just before the "start" timestamp
$adjstart = floor($start / 60);
// Create a data set in range (20,100) and X-positions
// We also apply a simple low pass filter on the data to make it less
// random and a little smoother
$data = array();
$xdata = array();
$data[0] = rand(20,100);
$xdata[0] = $adjstart;
for( $i=1; $i < NDATAPOINTS; ++$i ) {
$data[$i] = rand(20,100)*0.2 + $data[$i-1]*0.8;
$xdata[$i] = $adjstart + $i * SAMPLERATE;
}
// Assume that the data points represents data that is sampled every 10s
// when determing the end value on the scale. We also add some extra
// length to end on an even label tick.
$adjend = $adjstart + (NDATAPOINTS+10)*10;
$graph = new Graph(500,250);
$graph->SetMargin(40,20,30,50);
// Now specify the X-scale explicit but let the Y-scale be auto-scaled
$graph->SetScale("intlin",0,0,$adjstart,$adjend);
$graph->title->Set("Example on TimeStamp Callback");
// Setup the callback and adjust the angle of the labels
$graph->xaxis->SetLabelFormatCallback('TimeCallback');
$graph->xaxis->SetLabelAngle(90);
// Set the labels every 5min (i.e. 300seconds) and minor ticks every minute
$graph->xaxis->scale->ticks->Set(300,60);
$line = new LinePlot($data,$xdata);
$line->SetColor('lightblue');
$graph->Add($line);
$graph->Stroke();
?>